Earnings and the Gender Wage Gap
Median Annual Earnings
Women’s median annual earnings vary considerably across states (LINK TO TABLE 2.1).
- The District of Columbia ranked first in the nation for the median annual earnings of women working full-time, year-round in 2013. Women in the nation’s capital had considerably higher earnings ($60,000) than women in the second- and third-ranking jurisdictions, Maryland and Massachusetts, where women earned $49,800 and $48,500, respectively.
- In Arkansas, Idaho, Mississippi, and South Dakota, women have median annual earnings of $30,000, the lowest in the nation. Other states that rank in the bottom ten on this indicator include Louisiana, Montana, Nebraska, Oklahoma, South Carolina, and West Virginia.
During the last thirty years, men’s real earnings in the United States have remained essentially the same, while women’s have grown, albeit from a much smaller base. Between 1980 and 2013, after adjusting for inflation, real median earnings for women’s full-time, year-round work grew nationally from $30,138 to $39,157, while men’s decreased slightly from $50,096 to $50,033 (DeNavas-Walt and Proctor 2014). Among women, the growth in real median annual earnings took place in the 1980s and 1990s; since the early 2000s, women’s earnings, like men’s, have stagnated.
Changes to women’s and men’s real earnings vary across the states, however. IWPR analysis of the 1980, 1990, and 2000 Decennial Censuses (for the calendar years 1979, 1989, and 1999) indicates that between 1979 and 1999, women’s real earnings increased in all but three states (48) while men’s increased in only 18. Between 1999 and 2013, 27 states had positive earnings growth for women, with the strongest growth in North Dakota. During this time, men’s real earnings grew in only seven states (Figure 2.1). As men’s real earnings have stagnated or fallen, women’s earnings have become increasingly important to family economic security. As of 2012, 29 percent of women in married couples where both spouses work had annual earnings that were higher than their husbands’, an increase of 11 percentage points since 1987 (U.S. Bureau of Labor Statistics 2014a).
INSERT FIGURE 2.1
The Gender Earnings Ratio
The change and stagnation in women’s and men’s real earnings over the last several decades have contributed to the narrowing of the gender wage gap in earlier decades and more recently stalled progress in further closing this gap. Between 1980 and 2000—when women’s real earnings grew while men’s remained unchanged—the gender earnings ratio increased from 60.2 percent (in 1980) to 71.6 percent (in 1990) to 73.7 percent (in 2000). Between 2001 and 2012—when both women’s and men’s earnings stagnated—the gender earnings ratio remained virtually constant (76.3 percent in 2001 and 76.5 percent in 2012; DeNavas-Walt and Proctor 2014).
The gender earnings ratio improved between 2012 and 2013 from 76.5 to 78.3 percent (DeNavas-Walt and Proctor 2014), yet in every state in the nation, women still earn less than men (Table 2.1). The gender earnings ratio varies considerably among states, from 87.6 percent in New York, the best state, to 66.7 percent in Louisiana, the worst state.
- In addition to New York, four other jurisdictions have a gender earnings ratio of 85 percent or higher (87.4 in Maryland, 87.0 in the District of Columbia, 86.4 in Vermont, and 85.0 in Florida).
- Women in Louisiana earn just 66.7 cents on the dollar compared with men, the worst earnings ratio in the nation. In two other states—West Virginia (67.3 percent) and Wyoming (67.9 percent)—the gender wage gap is also greater than 30 cents per dollar.
The Gender Wage Gap: Best and Worst States
|
||||||||||||||||||||||||||||||||||||||||||||||||||||
If progress continues at the current rate since 1960, the disparity between women’s and men’s earnings in the United States overall will not close until the year 2058 (IWPR 2014a). Among the 50 states and the District of Columbia, Florida is projected to be the first state in the nation where women’s median annual earnings will reach parity with men’s, but not until the year 2038. In five states, women’s earnings are not expected to equal men’s until the next century. At the current rate of progress, the gender wage gap is expected to close last in Wyoming—in the year 2159 (Figure 2.2).
Figure 2.2. Projected Year for Closing the Gender Wage Gap by State
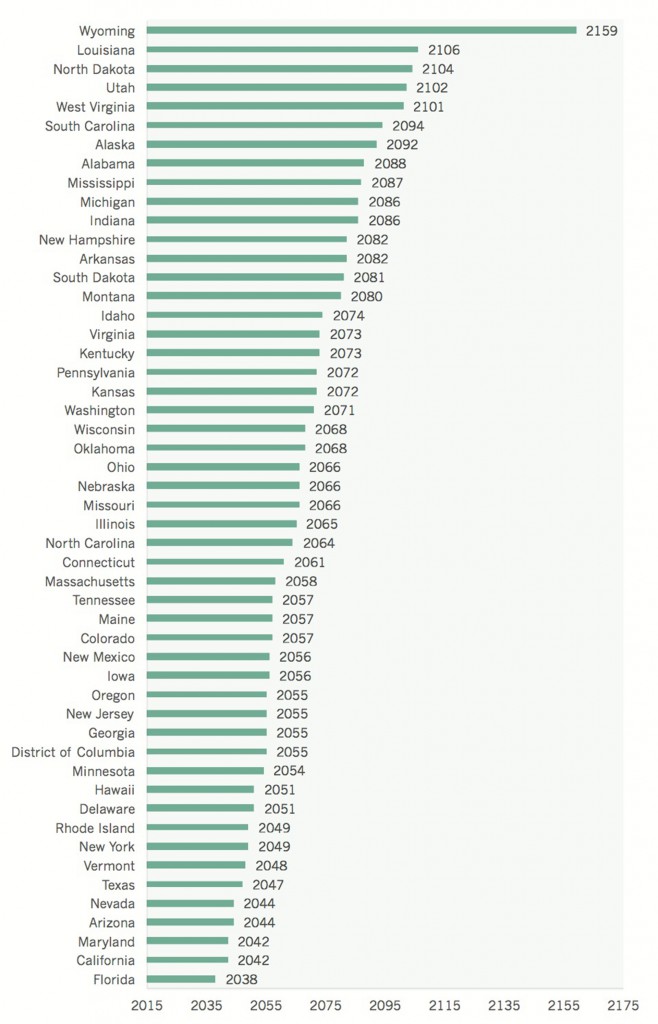
Note: Linear projection based on the current rate of progress in closing the gender wage gap since 1959. Projection is based on the ratio of women’s to men’s earnings among full-time, year-round workers aged 16 and older.
The Employment and Earnings of Older Women
The majority of older people (aged 65 and above) in the United States are women, and many are active in the workforce. In 2013, nearly 14 percent of women aged 65 and older were in the labor force; among the youngest of this age group—those aged 65–74— more than one in five women (22.0 percent) were in the workforce. Slightly more than half of women aged 65 and older work part-time (51.4 percent).
- The median annual earnings of women aged 65 and older who work full-time, year-round in the United States are $37,000, slightly less than the earnings for all women aged 16 and older ($38,000). Women aged 75 and older who work full-time, year-round have median earnings that are $8,000 less than those aged 65–74 ($30,000 compared with $38,000).
- The gender earnings ratio between women and men aged 65 and older who work full-time, year-round is lower than the earnings ratio between all women and men. Older women earn 72.5 cents on the dollar compared with their male counterparts.
- Approximately 35.6 percent of employed women aged 65 and older work in managerial or professional occupations, a smaller percentage than their male counterparts (42.7 percent). Among all employed women and men aged 16 and older, the pattern differs: women are considerably more likely than men to work in professional or managerial occupations (39.9 percent compared with 33.0 percent).
- As with all employed women and men, older women and men tend to be concentrated in different jobs. Older women are substantially more likely than older men to work in service or in office and administrative support occupations; more than four in ten (45.9 percent) older women work in these occupations, compared with just one in five (19.6 percent) older men. Older women are much less likely than their male counterparts to work in management, business, and financial occupations (12.0 percent compared with 21.0 percent) and in construction or production occupations (5.8 percent compared with 24.9 percent). These general patterns hold true for all-age women and men as well, with slight differences (see Table 2.7 below).
IWPR calculations based on 2013 American Community Survey microdata.
The Employment and Earnings of Millennials
The millennial generation has come of age in difficult economic times—in a period where student debt reached all-time highs and employment opportunities were in short supply. Research indicates that in 2013, the average loan debt among bachelor’s degree students graduating with debt from public and private nonprofit colleges was $28,400 (Reed and Cochrane 2014).
In the face of difficult economic times, millennial women—defined here as those aged 16–34 in 2013—are pursuing many different career paths and jobs. Much like their older counterparts, however, they face a range of challenges in the workforce.
- Nearly seven in ten (67.8 percent) millennial women (aged 16–34) are in the workforce, compared with 73.1 percent of their male counterparts.[1]
- Millennial women and men have been highly vulnerable to unemployment: 11.6 percent of millennial women and 12.5 percent of millennial men were unemployed in 2013, which is well above the unemployment rates for women and men overall.
- Millennial women face a gender wage gap, albeit one that is narrower than the wage gap between all women and men. In 2013, the median annual earnings for millennial women working full-time, year-round were $30,000, compared with $35,000 for their male counterparts, resulting in an earnings ratio of 85.7 percent. Between 2011 and 2013, millennial women earned less than millennial men in all but one state, New York, where women of this age range earned $38,319 compared with $37,542 for men (Table B2.2). For both millennial women and all women, New York is the best state for the gender wage gap, and the District of Columbia has the highest earnings.
- More than one in three (34.2 percent) millennial women work in managerial or professional occupations, compared with one in four (25.4 percent) millennial men.
- Millennial women are slightly more likely than millennial men to work in management, business, and financial operations (10.2 percent of employed millennial women compared with 9.7 percent of employed millennial men). Millennial women are also considerably more likely than their male counterparts to work in professional or related occupations (24.0 percent compared with 15.7 percent). As with older women, millennial women are much more likely than their male counterparts to work in service occupations (27.2 percent compared with 20.5 percent), and much less likely to work in construction or production occupations (5.4 percent of employed millennial women compared with 32.9 percent of employed millennial men).
IWPR calculations based on American Community Survey microdata. Earnings data for younger women and men by state are three-year (2011–2013) averages; all other data are for 2013.
For additional IWPR data on the employment and earnings of millennial women, see the March 2015 issue of Glamour Magazine, pp. 274–277.
Earnings and the Gender Wage Gap for Women of Color
Women’s earnings differ considerably by race and ethnicity. Across the largest racial and ethnic groups in the United States, Asian/Pacific Islander women have the highest median annual earnings at $46,000, followed by white women ($40,000). Native American and Hispanic women have the lowest earnings at $31,000 and $28,000, respectively (Figure 2.3).
Figure 2.3. Median Annual Earnings for Women and Men Employed Full-Time, Year-Round by Race/Ethnicity, United States, 2013

Notes: For women and men aged 16 and older. Racial groups are non-Hispanic. Hispanics may be of any race or two or more races.
Source: IWPR analysis of American Community Survey microdata (Integrated Public Use Microdata Series, Version 5.0).
While Asian/Pacific Islander women overall have the highest earnings and Hispanic and Native American women have the lowest earnings, significant differences exist within these groups. Among Asian/Pacific Islander women, Indian women have the highest median annual earnings at $60,879—more than twice the median earnings of the lowest earning group, the Hmong ($30,000), and approximately twice the earnings of the second lowest group, the Bangladeshi ($30,439). Among Hispanic women, Argentinian and Spanish women have the highest median annual earnings at $40,804 and $40,586, respectively, while Honduran and Guatemalan women have the lowest earnings at $22,784 and $23,337. Among Native American women, median annual earnings are highest among the Chickasaw ($42,000), and lowest among the Sioux ($28,410) and Apache ($28,500; Table B2.3). These earnings differences likely stem, in part, from differences in education levels; women from the higher-earning racial and ethnic groups are more likely to hold a college degree (IWPR 2015).
In all the racial and ethnic groups shown in Figure 2.3 and all but two of the detailed groups shown in Table B2.3—the Pueblo and “other” Central Americans—women earn less than men. Among the groups in Figure 2.3, the differences are smallest for blacks and Hispanics, due to the comparatively low earnings of black and Hispanic men, which are considerably less than the earnings of men overall.
Another way of examining gender earnings differences is to compare earnings for different groups of women with the largest group in the labor force, white men. Hispanic women face the largest earnings gap, with median annual earnings that are slightly more than half those of white men (53.8 percent). Asian/Pacific Islander women face the smallest gap, but still earn only 88.5 percent of white men’s earnings (Table 2.2).
Table 2.2. Women’s and Men’s Median Annual Earnings and the Gender Earnings Ratio, Full-Time, Year-Round Workers, United States, 2013
The Earnings Ratio by Educational Attainment
Education increases women’s earnings but does not eliminate the gender wage gap. In the United States, women with a bachelor’s degree earn, on average, more than twice the amount that women with less than a high school diploma earn (Figure 2.4). Yet, women who work full-time, year-round earn less than men at the same educational level, and at all but one level they earn the same as or less than men with lower educational qualifications. The gap in earnings is largest for those with the highest levels of educational attainment: women with a graduate degree earn only 69.1 percent of what comparable men earn, and women with a bachelor’s degree earn 71.4 percent of the amount their male counterparts earn. These data indicate that women need more educational qualifications than men do to secure jobs that pay well.
Figure 2.4. Median Annual Earnings and the Gender Earnings Ratio for Women and Men at Different Educational Levels, 2013
- Median annual earnings for women with at least a bachelor’s degree are highest in the District of Columbia ($74,000). Five other states—California, Connecticut, Maryland, New Jersey, and New York—have median annual earnings for women with a bachelor’s degree or higher of at least $65,000 per year (Table B2.4).
- Median annual earnings for women with a bachelor’s degree or higher are lowest in South Dakota ($38,000). Oklahoma has the second lowest earnings for women with at least a bachelor’s degree at $42,000, followed by Mississippi ($43,000; Table B2.4).
- The District of Columbia has the highest gender earnings ratio for workers with at least a bachelor’s degree (86.0 percent), followed by North Dakota (85.5 percent) and Rhode Island (84.9 percent; Table B2.4). The gender earnings ratio for workers with at least a bachelor’s degree is lowest in New Hampshire and Texas (both at 65.0 percent). In three other states, the ratio is also below 67 percent (South Carolina at 66.2 percent, and Arizona and Virginia at 66.7 percent; Table B2.4).
State Statutes That Address the Gender Wage Gap
- Tackling Pay Secrecy: As of 2014, ten states had enacted laws that prohibit employer retaliation against employees who inquire about other employees’ wages or disclose their own: California, Colorado, Illinois, Louisiana, Maine, Michigan, Minnesota, New Hampshire, New Jersey, and Vermont (U.S. Department of Labor 2014).
- Tackling the Undervaluation of Women’s Work: As of January 2015, the District of Columbia and at least five states—Iowa, Minnesota, Montana, Washington, and West Virginia—have “comparable worth” statutes or regulations for public employees to address the undervaluation of work performed mainly by women. These statutes and regulations require that compensation for work of comparable worth—measured by the skill, effort, responsibility, and working conditions—be equitable (IWPR n.d.).
- Tackling Low Wages: As of January 1, 2015, 29 states and the District of Columbia had a minimum wage that was higher than the federal minimum wage of $7.25. The minimum wage was highest in the District of Columbia at $9.50 per hour; seven states had a minimum wage of at least $9.00 per hour (U.S. Department of Labor 2015a). Several other states are scheduled to increase above $9.50 in future years.Tackling the Low Tipped Minimum Wage: As of 2014, seven states required employers to pay tipped workers the full state minimum wage: Alaska, California, Minnesota, Montana, Nevada, Oregon, and Washington (U.S. Department of Labor 2015b). An additional 26 states and the District of Columbia required employers to pay tipped workers above the federal tipped minimum wage of $2.13 an hour, ranging from a state tipped minimum wage of $2.23 in Delaware to a state tipped minimum wage in Connecticut of $5.78 (for the hotel and restaurant industry) and $7.46 (for bartenders who customarily receive tips; U.S. Department of Labor 2015b).
Cumulative Losses from the Gender Wage Gap
Losses from the gender wage gap accumulate over the course of a woman’s lifetime. Average lifetime losses for all women who were born between 1955 and 1959 and worked full-time, year-round each year total $531,502 by age 59 (Figure 2.5). Among college-educated women, the losses were even greater, due in part to the larger gender wage gap that women with this level of education face (see Figure 2.4). Women with a college education who were born between 1955 and 1959 and worked full-time, year-round each year lost, on average, nearly $800,000 by age 59 due to the gender wage gap (Figure 2.5).
Figure 2.5. Cumulative Losses from the Gender Wage Gap for All Women and College-Educated Women Born in 1955–1959, United States
Gender Inequality in Low and High Paid Jobs
Median earnings capture the midpoint in the earnings distribution: half of all workers earn above and half earn below the median. Another way of comparing earnings is to examine the gender composition of those among the highest and lowest earnings quartiles in a state. In 2013, women were less likely than men to be among the highest earners in all states in the nation (Table B2.5).
- The District of Columbia has the highest proportion of women among the top quartile of earners at 21.5 percent. New York and Nevada tie for second with 20.5 percent each, followed by Rhode Island (20.4 percent). Women are least likely to be in the highest-earning quartile in Wyoming (10.4 percent), Utah (12.5 percent), and West Virginia (13.4 percent).
- The states with the largest proportions of women in the lowest earnings quartile are Louisiana (34.6 percent), West Virginia (34.5 percent), and Utah (33.7 percent). Women are least likely to have earnings in the lowest quartile in the District of Columbia (21.7 percent), Alaska (24.0 percent), and Rhode Island (25.1 percent)
The Union Advantage for Women
Union representation brings wage setting into the open and helps ensure that employers set wages based on objective criteria, such as skill, effort, and responsibility. Unions tend to raise wages for all represented workers, especially those, research shows, who are at the middle and bottom of the wage distribution, who are disproportionately women (Jones, Schmitt, and Woo 2014).
- Among full-time workers aged 16 and older, women represented by unions earn an average of $212, or 30.9 percent, more per week than women in nonunion jobs.[1] Men of the same age range who are represented by unions earn, on average, $173 more per week (or 20.6 percent) than those without union representation (Table 2.5).
- Women who are represented by unions earn 88.7 cents on the dollar compared with their male counterparts, a considerably higher earnings ratio than the earnings ratio between all women and men in the United States.
- Among the racial and ethnic groups shown in Table 2.5, the difference in earnings between those with and without union representation is largest for Hispanics. Hispanic women represented by unions have median weekly earnings that are 42.1 percent higher than those without union representation. Hispanic men with union representation have earnings that are 40.6 percent higher than their nonunion counterparts.
- Earnings are calculated for all workers and are not controlled for education or sector of employment; when controlled for these factors, the union advantage is smaller but still significant, especially for women and minorities (Jones, Schmitt, and Woo 2014).
Table 2.5 Union Wage Advantage by Gender and Race/Ethnicity, United States, 2014
Median Weekly Earnings for Full-Time Wage and Salary Workers

Note: Hispanics may be of any race or two or more races and are classified by both ethnicity and race. Data are not available for Native Americans or those who identify with two or more races. Self-employed workers are excluded.
Source: IWPR compilation of data from the U.S. Bureau of Labor Statistics (2015b).