In This Section
The Work and Family Composite Score
The Gap in Mothers’ and Fathers’ Labor Force Participation Rates
Introduction
Women make up almost half of the workforce. Few families have someone who can stay at home to take care of health emergencies, pick children up from school and supervise homework, or take an elderly parent to a doctor’s appointment. In half of all families with children, women are the primary or co-breadwinner1 (IWPR 2015a). Low-income families are particularly likely to have all parents in the labor force (Boushey 2014).
Yet, as mothers’ labor force participation has dramatically increased in the past decades (U.S. Bureau of Labor Statistics 2014) and the number of women and men aged 50 and older who provide care for a parent has tripled during the last 15 years (MetLife 2011)2, the development of an infrastructure to support workers with family caregiving responsibilities has been largely neglected. Many workers lack access to even the most basic supports such as earned sick days and job-protected paid parental leave. Quality child care is also out of reach for many families because it is not affordable. Women are the large majority of family caregivers,3 and in the absence of reliable family supports, too many women are forced to make difficult decisions between keeping their jobs and caring for their family members.
Investments in work-family supports not only improve women’s economic security, but also contribute to economic growth (Council of Economic Advisors 2014). This report examines available supports for work and family at the state level. It begins with an overview of the work and family composite index and the overall ranking of states in this area of women’s status. It then discusses paid leave, elder and dependent care, motherhood and work and female breadwinners, and child care and preschool education. The report ends with a discussion of differences in the time spent on paid and unpaid work between mothers and fathers.
The Work and Family Composite Score
The work and family composite compares states’ performance across three components of work-family policy—paid leave, dependent and elder care, and child care—and a fourth component, the gender gap in the labor force participation of parents of children under six, an indicator that highlights gender inequality in family care of young children. This is the first IWPR Status of Women in the States report to include the work and family composite. Each of the three policy components has a number of indicators selected to represent the ease or difficulty of obtaining work family supports.
| Best and Worst States on Work & Family |
|||||
| State | Rank | Grade | State | Rank | Grade |
| New York | 1 | B | Indiana | 51 | F |
| California | 2 | B | Utah | 50 | F |
| District of Columbia | 3 | B | Montana | 49 | F |
| New Jersey | 4 | B- | Mississippi | 48 | D- |
| Rhode Island | 5 | B- | Wyoming | 47 | D- |
The paid leave component includes state policies on Temporary Disability Insurance (TDI), paid family and medical leave, and paid sick days. For dependent and elder care, the component includes the availability of unemployment insurance benefits for a worker who has to leave employment for family care reasons; the availability and level of dependent care tax credits for the care of a dependent adult relative; and the delegation of long-term support services to domestic care agency staff (such delegation can lower the costs of providing care for a family member). The child care component includes three indicators, enrollment of four-year-olds in publicly funded Pre-Kindergarten, Preschool Special Education, and State and Federal Head Start programs, state systems to ensure quality of Pre-K education, and the costs of center-based infant care. The indicator selection is intended to provide a succinct portrait rather than a comprehensive catalogue of all aspects of work and family; the selection of indicators is also informed by the availability of data for state-by-state comparisons.
Each of the four components of the work and family composite index, or indices, is weighted equally. Out of a maximum score of 8 across all indices, state composite scores range from a low of 2.03 to a high of 5.55, with higher scores reflecting a stronger performance in this area of women’s status and receiving higher letter grades (Table 3.1).
■ New York, California, and the District of Columbia have the highest scores on the work and family composite index, which reflects, in part, high rankings on paid leave. None of the highest ranking states, however, consistently ranks in the top ten states for each of the four component indices.
■ Indiana, Montana, and Utah have the lowest scores on the work and family composite index overall and rank in the bottom ten states for three of the four components.
■ States in the Pacific, Midwest, and Northeast are most likely to be among the top performing states; states in the Mountain West are least likely to perform well in the area of work and family.
■ No state received a grade higher than a B on the work and family composite index. California, New York, and the District of Columbia received a B, and New Jersey, Rhode Island, and Oregon a B-. Three states— Indiana, Utah, and Montana—each received an F.
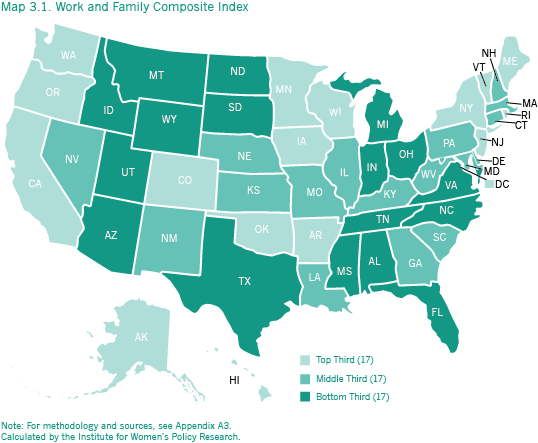
Table 3.1.How the States Measure Up: Women’s Status on the Work and Family Composite Index and Its Components
| State | Composite Index | Paid Leave Legislation Index | Elder and Dependent Care Index | Child Care Index | Gender Gap in Parents’ Labor Force Participation Ratesa | ||||||
| Score | Rank | Grade | Score | Rank | Score | Rank | Score | Rank | Percentage Points | Rank | |
| Alabama | 3.13 | 39 | D | 0.00 | 12 | 0.13 | 46 | 1.42 | 11 | 20.9 | 7 |
| Alaska | 4.34 | 15 | C | 0.00 | 12 | 1.50 | 8 | 1.37 | 15 | 26.5 | 32 |
| Arizona | 3.14 | 38 | D | 0.00 | 12 | 0.81 | 27 | 0.97 | 39 | 31.9 | 46 |
| Arkansas | 4.63 | 8 | C+ | 0.00 | 12 | 1.69 | 5 | 1.54 | 5 | 29.9 | 42 |
| California | 5.30 | 2 | B | 2.00 | 1 | 1.00 | 22 | 0.95 | 40 | 32.3 | 47 |
| Colorado | 4.53 | 11 | C+ | 0.00 | 12 | 2.00 | 1 | 1.11 | 31 | 28.9 | 38 |
| Connecticut | 4.09 | 21 | C | 0.67 | 5 | 0.81 | 27 | 1.07 | 34 | 23.3 | 12 |
| Delaware | 3.85 | 25 | C– | 0.00 | 12 | 1.06 | 21 | 1.21 | 26 | 21.3 | 8 |
| District of Columbia | 5.20 | 3 | B | 0.67 | 5 | 1.38 | 14 | 1.73 | 2 | 28.8 | 37 |
| Florida | 2.82 | 43 | D– | 0.00 | 12 | 0.00 | 49 | 1.34 | 17 | 26.3 | 30 |
| Georgia | 4.19 | 18 | C | 0.00 | 12 | 1.13 | 19 | 1.57 | 4 | 25.7 | 24 |
| Hawaii | 4.45 | 13 | C+ | 0.67 | 5 | 1.88 | 3 | 0.53 | 50 | 30.6 | 44 |
| Idaho | 2.61 | 46 | D– | 0.00 | 12 | 0.81 | 27 | 0.57 | 47 | 38.7 | 50 |
| Illinois | 3.49 | 30 | D+ | 0.00 | 12 | 0.69 | 34 | 1.32 | 21 | 25.8 | 26 |
| Indiana | 2.03 | 51 | F | 0.00 | 12 | 0.00 | 49 | 0.56 | 48 | 26.6 | 33 |
| Iowa | 4.62 | 9 | C+ | 0.00 | 12 | 1.50 | 8 | 1.49 | 7 | 18.6 | 3 |
| Kansas | 3.48 | 31 | D+ | 0.00 | 12 | 0.88 | 25 | 1.14 | 29 | 26.7 | 34 |
| Kentucky | 3.44 | 32 | D+ | 0.00 | 12 | 0.50 | 40 | 1.50 | 6 | 27.8 | 36 |
| Louisiana | 4.11 | 20 | C | 0.00 | 12 | 1.19 | 18 | 1.43 | 9 | 25.6 | 23 |
| Maine | 4.57 | 10 | C+ | 0.00 | 12 | 1.56 | 7 | 1.28 | 23 | 13.7 | 1 |
| Maryland | 4.06 | 22 | C | 0.00 | 12 | 1.13 | 19 | 1.40 | 13 | 23.1 | 11 |
| Massachusetts | 3.86 | 24 | C– | 0.67 | 5 | 0.63 | 37 | 1.04 | 38 | 23.5 | 13 |
| Michigan | 2.75 | 44 | D– | 0.00 | 12 | 0.00 | 49 | 1.23 | 25 | 24.0 | 17 |
| Minnesota | 4.76 | 7 | C+ | 0.00 | 12 | 2.00 | 1 | 1.18 | 28 | 20.8 | 6 |
| Mississippi | 2.55 | 48 | D– | 0.00 | 12 | 0.19 | 44 | 0.77 | 42 | 20.2 | 5 |
| Missouri | 3.64 | 28 | C– | 0.00 | 12 | 1.00 | 22 | 1.11 | 31 | 23.7 | 15 |
| Montana | 2.30 | 49 | F | 0.00 | 12 | 0.19 | 44 | 0.60 | 46 | 24.0 | 17 |
| Nebraska | 4.16 | 19 | C | 0.00 | 12 | 1.50 | 8 | 1.14 | 29 | 24.2 | 19 |
| Nevada | 3.91 | 23 | C– | 0.00 | 12 | 1.44 | 13 | 1.06 | 37 | 29.1 | 39 |
| New Hampshire | 3.40 | 34 | D+ | 0.00 | 12 | 1.38 | 14 | 0.51 | 51 | 24.3 | 20 |
| New Jersey | 4.99 | 4 | B– | 1.67 | 2 | 0.44 | 42 | 1.42 | 11 | 26.3 | 31 |
| New Mexico | 3.65 | 27 | C– | 0.00 | 12 | 0.88 | 25 | 1.37 | 15 | 29.7 | 41 |
| New York | 5.55 | 1 | B | 1.00 | 4 | 1.69 | 5 | 1.38 | 14 | 25.7 | 25 |
| North Carolina | 3.35 | 35 | D+ | 0.00 | 12 | 0.38 | 43 | 1.45 | 8 | 23.8 | 16 |
| North Dakota | 2.93 | 42 | D | 0.00 | 12 | 0.81 | 27 | 0.63 | 44 | 25.9 | 27 |
| Ohio | 3.27 | 37 | D+ | 0.00 | 12 | 0.81 | 27 | 0.91 | 41 | 23.0 | 10 |
| Oklahoma | 4.50 | 12 | C+ | 0.00 | 12 | 1.31 | 17 | 1.78 | 1 | 29.6 | 40 |
| Oregon | 4.89 | 6 | B– | 0.33 | 9 | 1.88 | 3 | 1.20 | 27 | 26.0 | 28 |
| Pennsylvania | 3.43 | 33 | D+ | 0.33 | 9 | 0.50 | 40 | 1.07 | 34 | 23.5 | 13 |
| Rhode Island | 4.94 | 5 | B– | 1.33 | 3 | 0.75 | 33 | 1.31 | 22 | 22.9 | 9 |
| South Carolina | 3.64 | 28 | C– | 0.00 | 12 | 0.81 | 27 | 1.33 | 19 | 25.2 | 21 |
| South Dakota | 3.07 | 40 | D | 0.00 | 12 | 0.69 | 34 | 0.67 | 43 | 14.5 | 2 |
| Tennessee | 3.03 | 41 | D | 0.00 | 12 | 0.13 | 46 | 1.43 | 9 | 26.1 | 29 |
| Texas | 3.34 | 36 | D+ | 0.00 | 12 | 0.94 | 24 | 1.07 | 34 | 33.3 | 49 |
| Utah | 2.27 | 50 | F | 0.00 | 12 | 0.56 | 39 | 0.56 | 48 | 42.7 | 51 |
| Vermont | 4.33 | 16 | C | 0.00 | 12 | 1.50 | 8 | 1.34 | 17 | 25.4 | 22 |
| Virginia | 2.69 | 45 | D– | 0.00 | 12 | 0.13 | 46 | 1.10 | 33 | 27.1 | 35 |
| Washington | 4.44 | 14 | C+ | 0.33 | 9 | 1.50 | 8 | 1.25 | 24 | 31.8 | 45 |
| West Virginia | 3.77 | 26 | C– | 0.00 | 12 | 0.69 | 34 | 1.69 | 3 | 30.2 | 43 |
| Wisconsin | 4.31 | 17 | C | 0.00 | 12 | 1.38 | 14 | 1.33 | 19 | 19.6 | 4 |
| Wyoming | 2.60 | 47 | D– | 0.00 | 12 | 0.63 | 37 | 0.63 | 44 | 32.7 | 48 |
Notes: aFor mothers and fathers with children younger than age six. The gap is measured as fathers’ labor force participation rate minus mothers’ labor force participation rate. See Appendix A3 for methodology and sources. For additional detail on the components of the indicators, see Appendix Tables B3.1–B3.4.
Calculated by the Institute for Women’s Policy Research.
Paid Leave and Paid Sick Days
Everyone is likely to need to take leave from work at some time due to personal illness, the demands of parenthood, or the need to provide care for someone in their family. Because women are the majority of those providing care for children as well as elderly and disabled adult family members, and because of their greater need for leave related to pregnancy and childbirth, having access to job-protected paid leave is particularly import- ant for them. Research has documented the benefits of paid leave for women and their families and the negative effects of not having access to leave.4 Paid leave helps women remain in the labor force when faced with caregiving responsibilities—whether the caregiving is for a baby, child, parent, or spouse—and the continuous attachment to the labor force can also help them advance in their careers. Paid leave for men can help address the unequal division of caregiving tasks between women and men and can reduce the potential of stereotyping and discrimination against women if they are the only ones making use of paid leave benefits (Patnaik 2015). The United States is one of only two countries in the world without a national paid maternity leave law, and one of a small minority of high-income countries that does not require employers to provide paid sick days (Earle, Mokomane, and Heymann 2011; International Labour Organisation 2014; Ray, Sanes, and Schmitt 2013).
The Family and Medical Leave Act (FMLA) of 1993 provides up to 12 weeks of unpaid, job-protected leave in a given year to care for a newborn or a newly adopted or fostered child, to address one’s own serious health condition, or to care for a family member with a serious health condition; 26 weeks of leave are available for care of an injured service member (Gault et al. 2014). Because of restrictions in coverage to employees working for public and private employers with 50 or more employees within 75 miles of their worksite, and who have worked at least 1,250 hours in the past year, only 59 percent of employees are eligible to take FMLA leave (Klerman, Daley, and Pozniak 2014). Coverage is also restricted because of the law’s narrow definition of family. Spouses (including same-sex spouses5), children, grandchildren, and parents are included, but care for an adult child (unless mentally or physically disabled), sibling, parent-in-law, or grand-parent is not.
State Laws That Expand Family and Medical Leave Coverage
■ Expanding access to workers in smaller businesses. As of 2014, six states—Maine, Maryland, Minnesota, New Jersey, Oregon, and Vermont—and the District of Columbia had expanded Family and Medical Leave eligibility to workers of smaller businesses, ranging from those with at least 15 employees within 75 miles of the worksite in Maine, Maryland, and Vermont to 50 employees worldwide in New Jersey. (Gault et al. 2014; National Partnership for Women & Families 2014a)
■ Expanding access for pregnant workers: As of 2014, nine states—California, Connecticut, Hawaii, Iowa, Louisiana, Massachusetts, Montana, New Hampshire, and Washington—had expanded FMLA eligibility to workers of smaller business in cases of pregnancy only, ranging from those with any number of employees in Hawaii and Montana to those with at least 25 employees in Louisiana (Gault et al. 2014; National Partnership for Women & Families 2014a).
■ Expanding the length of job-protected leave: As of 2014, legislation in four states—Connecticut, Oregon, Rhode Island, and Tennessee—and the District of Columbia extended leave for private sector employees beyond 12 weeks, ranging from 16 weeks in Connecticut and the District of Columbia to 30 weeks in Rhode Island. An additional 11 states—Alaska, Colorado, Florida, Illinois, Massachusetts, New York, North Carolina, Pennsylvania, Vermont, Washington and Wisconsin— provided more than 12 weeks of leave for state employees. Three states—California, Oregon, and Washington—and the District of Columbia provided additional leave for birth mothers (National Partnership for Women & Families 2014a).
■ Including same-sex partners and spouses in the definition of family: In ten states—California, Colorado, Connecticut, Hawaii, Maine, New Jersey, Oregon, Vermont, Washington, Wisconsin—and the District of Columbia, same-sex partners or spouses were explicitly included in the definition of family (National Partnership for Women & Families 2014a).
■ Broadening the definition of family: In five states—California, Minnesota, Oregon, Rhode Island, and Washington—leave can be taken to care for a grandparent. In six states—California, New Jersey, Oregon, Rhode Island, Vermont, and Washington—leave can be taken to care for a parent- in-law. In California and Maine, leave can be taken to care for a sibling (Gault et al. 2014).
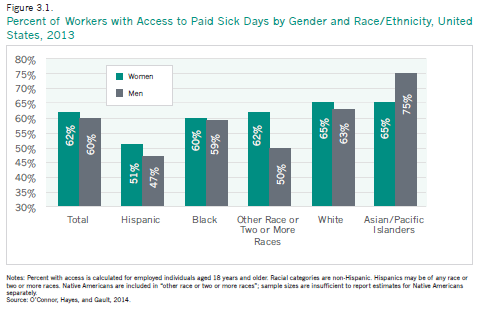
State laws and voluntary employer benefits are only partially filling the vacuum left by a lack of federal laws. Nearly 40 percent of all women workers, and about half of Hispanic women workers, do not have access to any paid sick time (Figure 3.1).
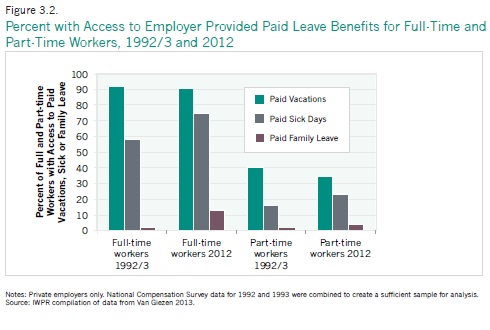
Part-time workers (the majority of whom are women) are only rarely covered by paid leave benefits of any kind (Figure 3.2). Less than half of employed women (41 percent) received paid maternity leave before or after the birth of their child (Laughlin 2011). Access to paid leave is highly unequal. Nine in ten high-income workers have access to paid sick time, compared with only one in five low-income workers (O’Connor, Hayes, and Gault 2014). Fifty-three percent of lower-income workers did not receive pay during their most recent FMLA leave, compared with just 18 percent of higher-paid workers who received paid leave as part of their employers’ bene- fit package (Klerman, Daley, and Pozniak 2014). Nearly half of all employees (46 percent) who reported that they needed leave for FMLA reasons in 2012 reported not having been able to take it because the leave would have been unpaid, and they could not forego the earnings (Klerman, Daley, and Pozniak 2014).
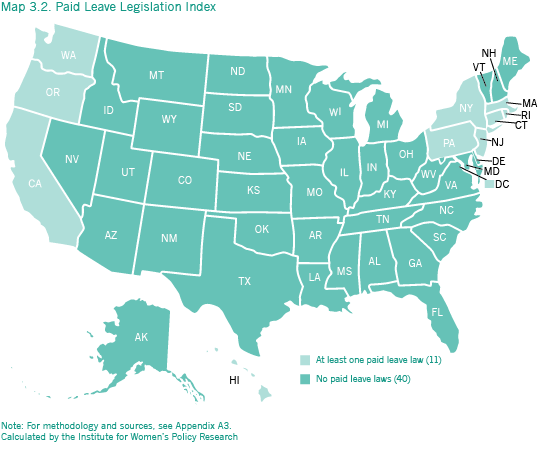
A small but growing number of states have statutes providing workers access to paid leave, with seven states providing some kind of leave as of early 2015. The work and family composite index scores states on three paid leave policies: Statewide Temporary Disability Insurance, or TDI (which provides women with paid maternity leave of four to six weeks for a normal pregnancy and birth as part of providing TDI to all workers with temporary disabilities); paid family leave insurance (which covers the care of newborns and care of family members with illness or aging parents, of the type covered under the FMLA for up to four to six weeks), and paid sick days.
■ California ranks highest on paid leave; it is the only state in which workers are covered by TDI and family leave insurance (up to six weeks of paid family leave) and have a right to earn paid sick days (paid for by employers). New Jersey and Rhode Island rank second and third, respectively. Both have statewide TDI and paid family leave insurance, and several cities in New Jersey have passed paid sick days laws. In Rhode Island, all private sector workers, irrespective of the size of their employer, have job protection while they are on paid family leave.
■ Four additional states and the District of Columbia provide the right to at least one type of paid leave: Hawaii and New York both offer TDI leave, 6 and Connecticut (albeit in a legislative framing that leaves a large number of workers uncovered), Massachusetts, and the District of Columbia require employers to provide paid sick days. Three additional states—Or- egon, Pennsylvania, and Washington7—include at least one city or district requiring that employers provide paid sick days.
■ In 40 states workers lack statutory rights to paid family and medical leave and do not have a statutory right to paid sick days on the job (Appendix Table B3.1).
Elder and Dependent Care
A quarter of the adult population under the age of 65 (24 percent) and an even larger share of those older than 65 (39 percent) have one or more disabilities (Centers for Disease Control and Prevention 2015; West et al. 2014). While many elderly people and many people with disabilities live healthy and independent lives, indeed, may provide support—financial or otherwise—for their families rather than needing support, many others rely on the care of family members to function. According to the 2009 National Caregiving Study, 66 million people provided informal care to an adult during that year, and over 40 million provided care for an adult in need of assistance with daily living (National Alliance for Caregiving and AARP 2009a,b). A study focused on care for those 65 years and older found that, in 2011, each month 9 million older adults received informal assistance, and 18 million family members and friends provided such informal care (Spillman et al. 2014). The large majority of caregivers under the age of 65 combine caregiving with paid work (MetLife 2011). Women are the majority of those who provide care for adult family members needing assistance, whether the person who needs care lives with them or elsewhere.8 As the Ameri- can population ages further—the share of the population age 65 and older has grown from 9.9 percent in 1970 to 14.1 percent in 2013 and is projected to reach 20 percent in 2030 (West et al. 2014; U.S. Census Bureau 2012a)— the demand for informal care will continue to increase, with proportionately fewer family members available to provide such care.9
Nationally, in 2011-2013 one in seven adult women under the age of 65 lived with a person aged 15 or older with one or more disabilities (Table 3.2).10 The share of women who live with someone with one or more disabilities varies considerably between states, from fewer than one in ten women under the age of 65 in Nebraska (9.8 percent) and North Dakota (9.6 percent) to one in five women in West Virginia (20.9 percent) and Mississippi (19.3 percent; Table 3.2).
The National Alliance for Caregivers and AARP study (2009a) found that, on average, caregivers spent 20 hours per week providing care, rising to almost 40 hours per week for those who lived with the person who needed care. The weekly time spent is not much lower for those who are employed: the 2014 Older Adult Caregiver Study found that adults who worked full-time while providing care for someone aged 50 spent a median of 16 hours per week on such care (Matos 2014). Time spent on support for parents and in-laws is twice as high for families living in poverty than it is for high-income families (Heymann 2005).
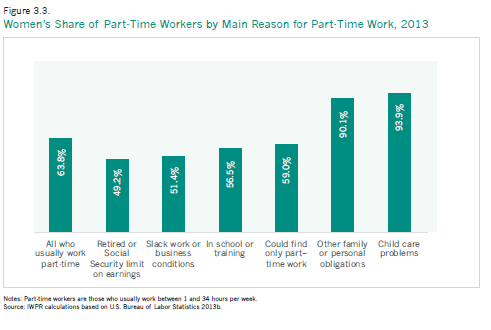
Balancing both employment and caregiving responsibilities, particularly for women, leads to significantly higher levels of stress than those experienced by non-caregiving peers (MetLife 2011). This effect may be even stronger for people with elder care responsibilities, as elder care needs may arise more suddenly and intensively, because of a fall or a stroke, for example, than care for a child, making it harder to plan and prepare (Reinhard et al. 2011). The unequal division of family caregiving work between women and men is demonstrated by the fact that women are nine times as likely as men to work part-time for family care reasons (Figure 3.3). Part-time work means lower earnings (and lower social security contributions) than full-time work; part-time workers are also much less likely than full-time workers to have access to paid leave of any kind or to benefit from employer contributions to employer-provided health insurance or pension plans (SHRM 2011; Van Giezen 2013). Women are also three times as likely as men to report having left their job because of caregiving responsibilities (6 percent compared with 2 percent respectively, according to a 2013 AARP survey of people aged 45 to 74; Perron 2014). A study by MetLife (2011) estimated that women with caregiving responsibilities who are over the age of 50 lose $324,044 in income and benefits over their lifetime when they completely exit the workforce for caregiving reasons.
Table 3.2.Women Living with a Person with a Disability, 2013
| State | Percent | State | Percent | State | Percent |
| Alabama | 18.0% | Kentucky | 18.5% | North Dakota | 9.6% |
| Alaska | 14.9% | Louisiana | 16.9% | Ohio | 14.4% |
| Arizona | 14.2% | Maine | 16.6% | Oklahoma | 17.2% |
| Arkansas | 18.6% | Maryland | 12.7% | Oregon | 15.4% |
| California | 14.5% | Massachusetts | 12.3% | Pennsylvania | 14.4% |
| Colorado | 11.4% | Michigan | 15.8% | Rhode Island | 13.5% |
| Connecticut | 11.6% | Minnesota | 10.6% | South Carolina | 16.3% |
| Delaware | 14.5% | Mississippi | 19.3% | South Dakota | 12.3% |
| District of Columbia | 10.6% | Missouri | 15.2% | Tennessee | 17.1% |
| Florida | 15.1% | Montana | 14.3% | Texas | 15.1% |
| Georgia | 15.1% | Nebraska | 9.8% | Utah | 13.3% |
| Hawaii | 18.6% | Nevada | 15.1% | Vermont | 12.2% |
| Idaho | 15.0% | New Hampshire | 12.7% | Virginia | 12.7% |
| Illinois | 12.4% | New Jersey | 12.8% | Washington | 14.0% |
| Indiana | 14.7% | New Mexico | 16.6% | West Virginia | 20.9% |
| Iowa | 11.3% | New York | 12.6% | Wisconsin | 11.6% |
| Kansas | 12.5% | North Carolina | 14.7% | Wyoming | 13.1% |
| United States | 14.4% |
Notes: Data are three-year (2011–2013) averages for women aged 16 to 64. Persons with one or more disabilities are aged 15 and older and need assistance with one or more of the following: hearing; vision; cognitive tasks because of difficulty remembering, concentrating, or making decisions); walking or climbing stairs; bathing or dressing; doing errands such as visiting a doctor’s office or shopping because of a physical, mental, or emotional problem.
Source: IWPR analysis of American Community Survey microdata (Integrated Public Use Microdata Series, Version 5.0).
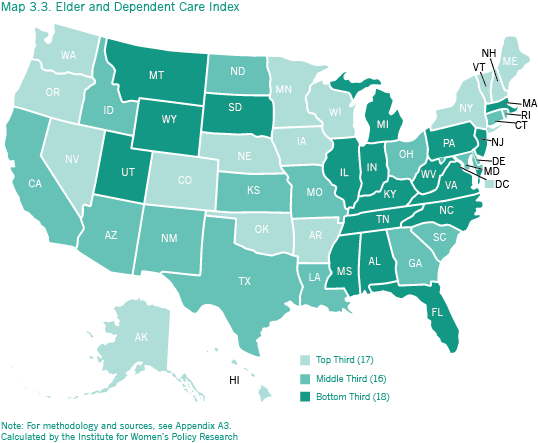
State policies can support family caregivers in a number of ways. They can support them directly through providing supports for respite care, assessments, training, and through legislating access to paid leave at work, and indirectly by properly funding and enforcing quality standards for nursing care and long-term service support workers (see Reinhard et al. 2014 for a state-by-state assessment of long-term care services and supports for older adults, people with disabilities, and family caregivers). Indicators of state-by-state family caregiver needs, and of work family supports specifically designed to support family caregivers, are still evolving.11 The elder and dependent care component of the work and family composite index scores states on three items linked to financial supports for caregivers: unemployment insurance benefits for workers who have to leave their jobs because of family care; tax credits for dependent care that are not limited to child care, are refundable, and are $500 or higher; and nurse delegation of long-term support service (LTSS) tasks to domestic care agency workers (nurse delegation of LTSS can lower the costs of hiring external help to provide care). In the context of the low earnings of many women, the high costs of hiring external help to care for a loved one may force a person to choose between her employment and providing the care herself.12
■ Twenty-four states and the District of Columbia recognize family care reasons as a legitimate cause of job loss for receiving unemployment insurance benefits (Appendix Table B3.2).
■ In 21 states and the District of Columbia, dependent care tax credits can be claimed for the care for an adult family member; in ten of these states the tax credit is refundable, and in 13 it is higher than $500 (Appendix Table B3.2).
■ Of a total of 16 medical tasks, 17 states allow nurse delegation to an agency domestic care worker of 14 or more tasks; 5 states do not allow any nurse delegation (Appendix Table B3.2).
■ The two best ranked states—Colorado and Minnesota—each make unemployment insurance available to someone who had to leave work to provide care for a family member, provide a refundable tax credit for dependent care of at least $500, and allow full delegation of LTSS to domestic care agency workers (Appendix Table B3.2).
■ The three worst ranked states—Florida, Indiana, and Michigan—do not extend unemployment insurance to workers who have to leave employment to provide family care, do not have a tax credit for dependent care, and do not allow nurse delegation of LTSS to domestic care agency workers (Appendix Table B3.2).
State and Local Laws to Support Caregivers at Work
Caregiver discrimination: A number of states have passed laws to protect family caregivers from discrimination at work (such as being fired for needing leave or denying leave for caregiving reasons or not being hired or promoted because one has caregiving responsibilities; Redfoot, Feinberg, and Smith Fitzpatrick 2014; Williams, Devaux, Petrac, and Feinberg 2012). The U.S. Equal Employment Opportunity Commission (EEOC) has clarified that both under Title VII of the Civil Rights Act and under the Americans with Disabilities Act it constitutes discrimination for an employer to treat a person adversely because he or she is a family caregiver or “associated with a person with a disability” (U.S. EEOC 2007). A number of states have issued laws to extend protections for family caregivers beyond what is covered in federal laws; most statutory protections in this field, however, have happened at the local level in cities and districts (Williams et al. 2012).
■ Connecticut, and the District of Columbia, as well as 30 localities in 12 states—Colorado, Florida, Illinois, Kansas, Kentucky, Maryland, Massachusetts, Michigan, New Jersey, New York, Oregon, and Pennsylvania—prohibit discrimination against employees who have family responsibilities, including providing care to parents or ill or disabled spouses (Williams, Devaux, Petrac, and Feinberg 2012).
■ Family caregiver discrimination protection in Alaska, New Jersey, and Oregon is limited to workers with child care responsibilities (Redfoot, Feinberg, and Smith Fitzpatrick 2014).
Rights to Request Flexible Work: Workers in Vermont and San Francisco, since 2014, have a formal “right to request” flexible work arrangements. The Vermont law defined these as “intermediate or long-term changes in the employee’s regular working arrangements, including changes in the number of days or hours worked, changes in the time the employee arrives at or departs from work, work from home, or job sharing” (Vermont Commission on Women 2014). Under the law the employer must consider an employee’s request in good faith and may not retaliate against an employee for making a request. The law does not provide a right to changed working conditions, and there are a number of legitimate reasons for an employer to reject a request. While the impact of the Vermont law has not yet been evaluated, similar laws elsewhere in the world have contributed to making alternative work arrangements more widely accessible to workers (Hegewisch 2009).
Seven in ten employed family caregivers made adjustments to their work arrangements in response to their caregiving responsibilities (National Alliance for Care- givers and AARP 2009a). The proportion of employers in the 2014 National Study of Employers reporting that they provide elder care supports and allow job-protected leave for employees with elder care needs has increased since 2008 (Matos and Galinsky 2015). Yet the same study also finds that a falling share of employers allow more systematic (rather than one-off ) adjustments to work arrangements. The share of employers who allow at least some employees to job share fell from 29 percent in 2008 to 18 percent in 2014, to take a sabbatical from 38 to 28 percent, and to have a break for personal or family responsibilities from 64 to 52 percent. Of those who left their jobs because of elder care responsibilities, more than half (52 percent) said they did so because their employers did not allow them the flexibility needed to combine work and elder care (Matos 2014). While both men and women find it difficult to combine employment with elder care, women are significantly more likely than men to report work-related difficulties (Matos 2014).
Predictable work schedules: In January 2015 the Retail Workers Bill of Rights became law in San Francisco. The law applies to large retailers and provides workers with a right to two weeks’ notice of their schedules; penalty pay if schedules are changed with less than one week’s notice; equal treatment for part-time and full-time workers; and minimum pay for workers who are on-call (whether they are called or not; Jobs with Justice 2015). San Francisco to date is the only locality to have passed such a statute; eight states and the District of Columbia have statutes that entitle an employee to receive some pay if he or she was scheduled to work but then is not needed (Golden 2015).
Whether caring for a child or a person with a disability, providing such care requires predictability and punctuality. Schedule irregularity, and corresponding variability in earnings, has increased strongly since 2000 and is reported by a significant number of workers irrespective of whether they formally work full-time, part-time, or are self-employed (Golden 2015). Schedule flexibility is a particular problem for low wage workers in retail and restaurants (Lambert, Fugiel, and Henly 2014; Watson and Swanberg 2011). According to one recent study, over four in ten mothers working in restaurants reported that their shifts changed weekly (39 percent) if not daily (6 percent); over a third of mothers had incurred fines from their child care provider or had to change their child care arrangement altogether because of scheduling changes (Restaurant Opportunity Center 2013).
Mothers as Breadwinners
The large majority of mothers are in the workforce, including 62 percent of mothers who gave birth within the last 12 months (U.S. Department of Labor Women’s Bureau 2015). One in three workers (32 percent) have children under 18, and of these, a quarter have children younger than 6 years old (U.S. Bureau of Labor Statistics 2014). Of the 33.4 million households with children under 18, 22.3 million are headed by married couples, 8.4 million by single mothers, and 2.7 million by single fathers (Figure 3.4). Married fathers also spend more time on child care than previously. Both mothers and fathers need accommodations at work, such as schedule flexibility.
Mothers’ earnings make a major contribution to their family’s income. In half of all families, they are the sole provider or, in married couples, contribute at least 40 percent of family earnings (Table 3.3). Single mothers are a slight majority of female breadwinners (51 percent of mothers who make at least 40 percent of household income). In married families with children, over a third of wives (37 percent) earn at least 40 percent of the couple’s joint earnings (Table 3.3). The share of female breadwinners13 varies considerably between states:
■ Among all families with children, the District of Columbia has the highest share (64 percent) of breadwinner mothers. Mississippi (59 percent) and Rhode Island (56 percent) also have high shares of households with female breadwinners. The states with the lowest share of female breadwinners are Utah (35 percent), Wyoming, and Idaho (42 percent each).
■ Among married couples with children, Vermont (46 percent), the District of Columbia (46 percent), and Iowa, Maine, and South Dakota (each at 44 percent) have the highest share of breadwinner mothers. The share of married breadwinner mothers among married couples with children is lowest in Utah (25 percent), Wyoming (31 percent), Idaho (32 percent), and Washington (33 percent).
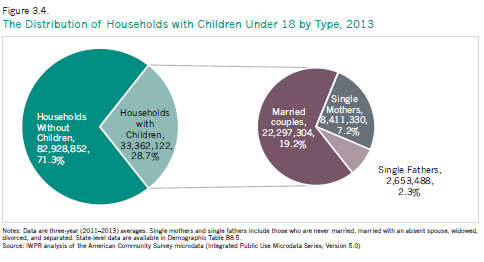
Table 3.3. Breadwinner Mothers in Households with Children under 18, 2013
| Households With Children Under 18* | Households with a Breadwinner Mother** as Percent of all Households with Children | Single Mothers as Percent of All Female Breadwinners** | Married Couples With Female Breadwinner* as Percent of All Married Couples | |||||
State |
Number |
Percent |
Percent |
Rank |
Percent |
Rank |
Percent |
Rank |
Alabama |
502,899 |
27.6% |
52.6% |
11 |
56.4% |
5 |
36.8% |
35 |
Alaska |
82,877 |
33.7% |
47.5% |
40 |
50.5% |
23 |
36.7% |
36 |
Arizona |
666,614 |
27.8% |
48.1% |
36 |
54.4% |
7 |
35.0% |
44 |
Arkansas |
312,044 |
27.7% |
52.1% |
17 |
52.1% |
20 |
39.5% |
17 |
California |
3,988,783 |
31.5% |
46.5% |
45 |
48.5% |
32 |
35.7% |
42 |
Colorado |
582,806 |
29.1% |
45.2% |
47 |
46.6% |
37 |
34.5% |
46 |
Connecticut |
392,974 |
29.3% |
50.8% |
25 |
49.9% |
25 |
37.9% |
27 |
Delaware |
90,717 |
26.8% |
53.7% |
6 |
49.6% |
26 |
42.3% |
9 |
District of Columbia |
47,606 |
17.5% |
64.1% |
1 |
66.1% |
1 |
46.4% |
1 |
Florida |
1,758,606 |
24.4% |
53.7% |
6 |
53.0% |
11 |
40.9% |
11 |
Georgia |
1,088,759 |
30.7% |
51.9% |
20 |
54.2% |
8 |
37.6% |
29 |
Hawaii |
121,349 |
27.0% |
48.9% |
33 |
39.3% |
51 |
40.8% |
13 |
Idaho |
183,685 |
31.2% |
42.1% |
49 |
44.8% |
42 |
32.2% |
49 |
Illinois |
1,382,018 |
28.9% |
48.8% |
35 |
49.4% |
27 |
36.5% |
37 |
Indiana |
716,063 |
28.7% |
48.9% |
33 |
52.4% |
16 |
36.0% |
38 |
Iowa |
343,487 |
27.8% |
52.2% |
15 |
42.5% |
47 |
43.8% |
5 |
Kansas |
332,979 |
29.9% |
47.2% |
42 |
45.3% |
40 |
37.0% |
33 |
Kentucky |
472,528 |
27.7% |
51.9% |
20 |
51.7% |
22 |
40.1% |
14 |
Louisiana |
487,165 |
28.2% |
53.6% |
8 |
63.1% |
2 |
34.9% |
45 |
Maine |
131,294 |
24.0% |
52.4% |
13 |
46.6% |
37 |
44.0% |
4 |
Maryland |
627,885 |
29.0% |
54.2% |
5 |
48.5% |
32 |
42.7% |
7 |
Massachusetts |
699,131 |
27.6% |
51.8% |
22 |
49.0% |
30 |
39.2% |
19 |
Michigan |
1,036,313 |
27.0% |
50.5% |
26 |
52.2% |
19 |
37.8% |
28 |
Minnesota |
606,880 |
28.6% |
51.1% |
24 |
40.2% |
50 |
43.3% |
6 |
Mississippi |
316,566 |
29.0% |
58.6% |
2 |
61.1% |
3 |
40.9% |
11 |
Missouri |
641,171 |
27.1% |
52.1% |
17 |
50.4% |
24 |
40.0% |
15 |
Montana |
101,786 |
25.1% |
47.3% |
41 |
44.2% |
44 |
38.5% |
24 |
Nebraska |
213,508 |
29.2% |
49.1% |
31 |
45.1% |
41 |
38.8% |
21 |
Nevada |
293,486 |
29.3% |
50.4% |
27 |
52.3% |
18 |
38.5% |
24 |
New Hampshire |
143,526 |
27.6% |
47.2% |
42 |
44.7% |
43 |
37.6% |
29 |
New Jersey |
995,862 |
31.4% |
47.6% |
38 |
46.8% |
36 |
36.0% |
38 |
New Mexico |
211,259 |
28.0% |
50.4% |
27 |
58.6% |
4 |
35.8% |
41 |
New York |
1,990,046 |
27.6% |
52.3% |
14 |
52.4% |
16 |
38.8% |
21 |
North Carolina |
1,053,449 |
28.0% |
53.1% |
10 |
52.6% |
15 |
39.9% |
16 |
North Dakota |
77,642 |
26.0% |
45.4% |
46 |
41.2% |
49 |
37.0% |
33 |
Ohio |
1,228,738 |
26.9% |
52.2% |
15 |
53.1% |
10 |
39.0% |
20 |
Oklahoma |
417,377 |
28.8% |
48.1% |
36 |
52.9% |
12 |
35.3% |
43 |
Oregon |
403,371 |
26.5% |
46.8% |
44 |
48.9% |
31 |
36.0% |
38 |
Pennsylvania |
1,286,000 |
26.0% |
50.4% |
27 |
49.4% |
27 |
38.5% |
24 |
Rhode Island |
108,144 |
26.6% |
55.6% |
3 |
53.6% |
9 |
42.2% |
10 |
South Carolina |
487,317 |
27.1% |
54.3% |
4 |
56.1% |
6 |
39.3% |
18 |
South Dakota |
90,472 |
27.3% |
52.6% |
11 |
43.6% |
45 |
44.2% |
3 |
Tennessee |
671,834 |
27.0% |
51.4% |
23 |
51.9% |
21 |
38.7% |
23 |
Texas |
2,990,853 |
32.8% |
47.6% |
38 |
52.8% |
13 |
33.7% |
47 |
Utah |
340,379 |
37.8% |
34.8% |
51 |
42.6% |
46 |
25.3% |
51 |
Vermont |
60,819 |
24.0% |
53.6% |
8 |
41.6% |
48 |
46.4% |
1 |
Virginia |
881,197 |
28.8% |
49.2% |
30 |
47.1% |
35 |
37.6% |
29 |
Washington |
756,558 |
28.6% |
44.2% |
48 |
48.0% |
34 |
33.3% |
48 |
West Virginia |
176,786 |
23.9% |
49.1% |
31 |
52.7% |
14 |
37.3% |
32 |
Wisconsin |
624,605 |
27.3% |
52.1% |
17 |
45.5% |
39 |
42.5% |
8 |
Wyoming |
62,054 |
27.7% |
42.1% |
49 |
49.1% |
29 |
30.7% |
50 |
United States |
33,280,267 |
28.6% |
49.8% |
50.7% |
37.4% |
|||
Notes: Data are three-year (2011–2013) averages. *As percent of all households in the state. **A breadwinner mother is defined as a single mother who is the main householder (irrespective of earnings) or a married mother who earns at least 40 percent of the couple’s joint earnings; single mothers who live in someone else’s household (such as with their parents) are not included.
Source: IWPR analysis of American Community Survey microdata (Integrated Public Use Microdata Series, Version 5.0).
■ The share of single mothers among female bread- winners is highest in the District of Columbia (66 percent), Louisiana (63 percent), and Mississippi (61 percent).
■ The share of married mothers among all breadwinner mothers is highest in Hawaii (61 percent); in 12 other states, married mothers are at least 55 percent of female breadwinners (Table 3.3).
Having children can present a formidable range of obstacles at work, starting from inadequate protections during and after pregnancy, the high costs of child care, particularly for young children, to a school day and school year unaligned with the working day. Added to such challenges are biases against mothers at work (Correll, Benard, and Paik 2007; Williams and Segal 2003). Research suggests that mothers’ earning power is curtailed by discrimination against them as mothers in addition to general factors that contribute to the gender wage gap (Budig 2014). Research finds no evidence that lower earnings are a reflection of lower productivity or of other factors that may justify lower earnings (Kmec 2011). The motherhood penalty is particularly marked for white mothers (Glauber 2007); the lack of a mother- hood penalty for women of color is likely an expression of higher general levels of discrimination faced by all black and Hispanic women and men.
Pregnancy at Work
The number of women who work during their pregnancies has increased sharply during the past decades (Laughlin 2011). Pregnancy-related employment discrimination has increased, too. Between 1992 and 2007, charges of pregnancy discrimination filed with the U.S. Equal Employment Opportunity Commission increased by 65 percent (National Partnership for Women and Families 2008) and have increased further since then (U.S. EEOC 2015). The National Partnership study found a particularly sharp rise in claims from women of color; they also found that pregnancy claims had increased in the majority of states.
The Pregnancy Discrimination Act (PDA) of 1978 clarified that employment discrimination on the basis of pregnancy, childbirth, or related medical conditions is sex discrimination under Title VII of the Civil Rights Act of 1964. The law prohibits an employer from firing, or refusing to hire, a woman because of pregnancy as long as she is still able to perform the major functions of her job, prohibits an employer from treating an applicant or worker differently on the basis of pregnancy, mandates that an employer treat an employee temporarily unable to perform her job the same way as any other temporarily disabled employee, and requires that any health insurance provided by an employer cover expenses for pregnancy-related conditions, among other provisions (U.S. Department of Labor 2015). Yet while the PDA protects women from pregnancy-related discrimination and from employers withholding benefits or accommodations to pregnant women that are received by other employees, it does not provide a general right to pregnancy accommodations (such as, for example, a temporary shift to lighter duties). Such rights are universal in other high-income countries (ILO 2014).
Since the Affordable Care Act was signed into law in 2010, new mothers returning to work have the right to reasonable time for pumping milk or breast feeding, in a private space, and to facilities for storing breast milk (U.S. Department of Labor Wages and Hours Division 2015b).14 The new rule in- creased potential access to breastfeeding especially for low-wage mothers who are less likely to breast- feed than mothers with higher earnings (Drago, Hayes, and Yi 2010). Breastfeeding has positive effects on infant and child health (Victora et al. 2015; Golen and Ramey 2014; Horta and Victora 2013).
State Laws to Expand Pregnancy Protection
■ Protections against pregnancy discrimination: Forty-five states and the District of Columbia offer protections against pregnancy discrimination. The five states that do not offer protections against pregnancy discrimination are Alabama, Indiana, Nevada, North Carolina, and South Dakota (U.S. Department of Labor 2015).
■ Pregnancy accommodation: In 14 states— Alaska, California, Connecticut, Delaware, Hawaii, Illinois, Louisiana, Maryland, Minnesota, Nebraska, New Jersey, North Dakota, Texas, and West Virginia—and the District of Columbia, as well as in five cities in other states, employers, by law, must provide reasonable accommodations for pregnant workers. Examples include transfers to a less strenuous or hazardous position, tasks that do not involve heavy lifting, breaks to go to the bathroom, and the option of sitting rather than standing (City of Pittsburgh 2014; National Partnership for Women & Families 2014c).
■ Workplace breastfeeding rights: Nineteen states and the District of Columbia have passed laws providing workplace breastfeeding rights (such as break times and a private space for pumping breast milk): Arkansas, California, Colorado, Connecticut, Delaware, Hawaii, Illinois, Indiana, Louisiana, Maine, Minnesota, Montana, New Mexico, New York, Oregon, Rhode Island, Tennessee, Vermont, and Virginia (U.S Department of Labor 2015).
Child Care
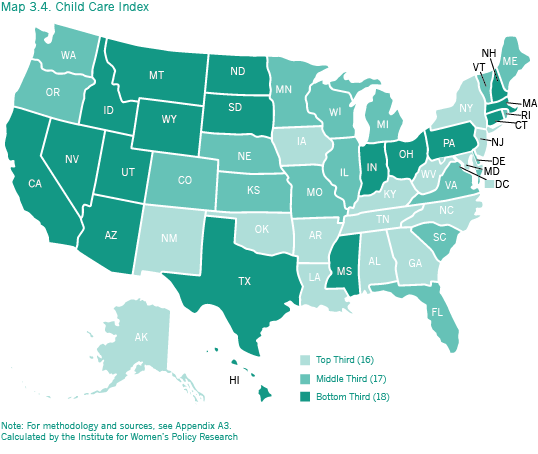
Reliable child care support is essential for parents’ employment. Quality early care and education also promote children’s school readiness and have positive effects that last into adulthood (Yoshikawa et al. 2013) and are important for developing economically vibrant communities (Warner 2009). State policies on child care and early care and education differ on many aspects, includ- ing access and affordability of provisions, the number of hours provided by public programs, the training and supports available to/required of providers and teachers, after school and school vacation care, subsidies for low-income parents, and guidance provided to parents choosing providers (see for example Barnett et al. 2013; Child Care Aware of America 2013 and 2014a; Minton and Durham 2013; QRIS Compendium 2015; Schmit and Reeves 2015; Schulman and Blank 2013). The child care component of the work and family composite index focuses on just three indicators: the costs of full-time center care for an infant as a proportion of the median annual earnings for women in the state, a measure chosen to illustrate the potential barriers created by the costs of care for families considering having children generally and particularly for mothers of young children who want to return to work; the share of four-year-olds who are in publicly funded Pre-K, Headstart, and Special Education; and policies in place to ensure quality of Pre-K care (each is discussed in greater detail below).15 States vary widely across these indicators. Families in the Northeast and the South tend to have better access to quality, affordable care than families in the Mountain States and the West, but no state provides adequate child care supports to a majority of children under five.
The Cost of Early Care
The cost of child care can present a formidable burden to families with young children. Between 1985 and 2011, the weekly out-of-pocket expenditure on child care for families with an employed mother almost doubled in real terms (U.S. Census Bureau 2013). Only a small minority of young children (16 percent of infants and 25.5 percent of toddlers of employed mothers and fewer than 5 percent of toddlers and infants of mothers who are not employed) are in center care (Laughlin 2013). Families with children who have income below the poverty line spent 30 percent of their income on child care in 2011, more than three times the proportion families with above-poverty income spent (U.S. Census Bureau 2013; Smith and Adams 2013). The majority of all parents rely on care by relatives (including older siblings and grand- parents), and more than one in four working mothers reports multiple child care arrangements (Laughlin 2013). Reliable and affordable child care is an important factor in enabling mothers in low-wage jobs to maintain employment and advance at work (Lee 2007).
As Child Aware of America (2014a) has documented, in the majority of states and the District of Columbia, the annual costs of center care for an infant are higher than the costs of attending a year of college at a public university, and in 22 states and the District of Columbia, the costs exceed 40 percent of the median annual income of single mothers. The infant care cost indicator in the child care component of IWPR’s work and family composite index compares the cost of center-based infant care to the median annual earnings of all women, regardless of their parental status. The cost of full-time annual center care for infants varies considerably between states.
■ The annual cost of center care for an infant as a proportion of women’s median earnings is lowest in Alabama (16.8 percent of women’s median annual earnings). In seven other states—Arkansas, Kentucky, Louisiana, Mississippi, South Carolina, South Dakota, and Tennessee—the costs are also lower than 20 percent of women’s median annual earnings.
■ The cost is highest in the District of Columbia (36.6 percent); in two other states—Massachusetts and Minnesota—costs are comparable to more than a third of annual earnings (Appendix Table B3.3).
This relative measure of the costs of child care does not capture the quality of center care. Indeed, lower relative costs of center care may simply reflect lower quality, such as high ratios of children to staff, larger group sizes, and lack of requirements for teacher certification. Lower cost may also indicate the absence of a market for higher-quality (higher-cost) infant care because of lower median earnings or, where costs are high, may be the sign of a market for high-quality, high-cost child care in response to higher numbers of well-paid women (such as in Washington, DC; Child Care Aware of America 2014a). By its nature, quality child care is labor intensive with limited scope for labor saving technologies or other cost saving innovations; without significant public funding, quality child care will remain out of reach for the majority of families (Blau 2001).
The regulation of center care is largely the responsibility of states rather than the federal government. The Child Care Development Block Grant (CCDBG) was reauthorized in 2014 (for the first time since 1996) with new health, safety, and licensing requirements for facilities receiving federal funds. Child care subsidies have a dual role, of raising the quality of programs, and of improving the access to quality programs for children in receipt of childcare subsidies. States are now required to inspect facilities that may receive CCDBG funds before they receive licensure, and at least annually once they are licensed, but have wide flexibility in setting other licensing and program parameters and vary widely in their licensing rules for child care centers (Child Care Aware of America 2013; 2014b).
The CCDBG mandates that states spend a minimum of three percent on the improvement of the quality of infant and toddler care and include a four-percent set-aside (to rise to nine percent over a five-year period) for improvements to the quality of child care (U.S. Department of Health and Human Services 2014a).
The National Association for Regulatory Assistance (NARA) and the National Association of Child Care Resource and Referral Agencies (NACCRRA) have developed minimum standards and benchmarks for licensing of child care facilities (Child Care Aware of America 2013; Fiene and Martella 2012). The majority of states—38 in 2014, a steep increase since 2004 when there were just 9—have quality rating and improvement programs in place to monitor and improve the quality of early childhood education and care (QRIS Compen- dium 2015). Quality Rating and Improvement Systems (QRIS) are designed to improve quality beyond basic licensing standards and use a star rating system to make it easier for parents who need child care or early education to decide between different providers (Mitchell 2005). There is considerable variation, however, in the funding, design, and implementation of QRIS systems among states (Tout et al. 2010; QRIS Compendium 2015).
Child Care Subsidies
Child care subsidies help mothers and fathers access better quality child care, improve performance and advancement at work, and reduce child care-–related work interruptions (Forry and Hofferth 2011; Tekin 2005; Wagner 2010). Nationally, in 2011, fewer than 4 percent of all infants and toddlers received any child care subsidies, and even among low-income families, only 11.8 percent of children under five received any financial supports for child care from government sources (Laughlin 2013). Federal funding for child care is provided to states through the Child Care Development Block Grant (CCDBG). States are permitted to use funds from the CCDBG to provide subsidies to eligible families with incomes below 85 percent of state median income, and states have considerable flexibility in how the subsidy system is designed and how families when earnings rise above the income eligibility levels are treated (Minton and Durham 2013). Whether parents receive child care assistance depends on a host of factors and policy decisions that differ from state to state, such as income eligibility limits, work requirements, waiting lists for child care assistance, copayments required of parents receiving child care assistance, reimbursement rates for child care providers serving families receiving child care assistance, and eligibility for child care assistance for parents searching for a job (Schulman and Blank 2013).
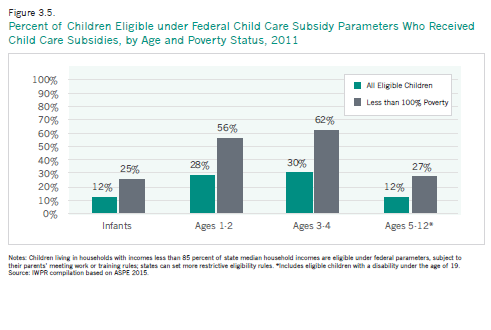
In 2011—the most recently published national data—only 17 percent of potentially eligible children under the federal CCDBG parameters received any child care subsidy (ASPE 2015).16 Figure 3.5 shows the proportion of eligible children who received subsidies for different age groups; even the lowest-income households (with incomes of less than 100 percent of poverty) were often left to their own devices, with only 25 percent of eligible infants, and 56-62 percent of eligible toddlers, having received any subsidies (Figure 3.5).
CCDBG rules require most families to pay part of the child care costs, but the share of families required to make a co-payment varies widely between states (from fewer than 15 percent of families in Arkansas and Nebraska to 90 percent or more of families in Connecticut, Illinois, New Hampshire, Ohio, and Utah (U.S. Department of Health and Human Services 2014a). The level of co-pay also varies widely, from an average of 3 percent of family income in the District of Columbia, Michigan, and Minnesota to 26 percent in Mississippi (U.S. Department of Health and Human Services 2014b).17
The Coverage and Quality of Pre-Kindergarten Education
The benefits of preschool education for children’s cognitive and social development are well established (see Yoshikawa et al. 2013 for a review of the evidence). Expansions of publicly funded early care and education also improve mothers’ labor force participation and wage progression (Cascio 2006; Gelbach 2002) and have economic and job-creation benefits as a local economic development strategy (Warner 2009).
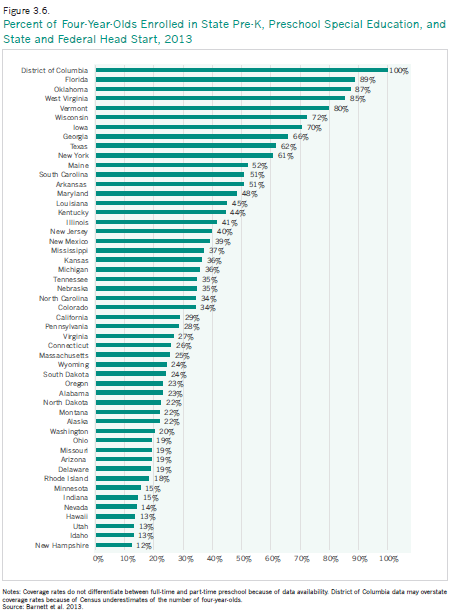
Nationally, in the 2012/2013 school year, 40.1 percent of four-year-olds were enrolled in publicly funded Pre-K, Head Start, or special education programs (27.9 percent were in Pre-K, and 12.2 percent were in Head Start18 or special education; Barnett et al. 2013). The national proportion of four-year-old children who are in publicly funded programs19 has increased substantially since 2001/2002, when it was only 31.2 percent (Barnett, Robin, Hulstedt, and Schulman 2003). The level of enrollment varies dramatically across the states. Figure 3.6 shows the state-by-state differences in the overall enrollment in public education for four-year-olds, irrespective of the numbers of hours provided per child.20 Enrollment rates vary from only 12 percent in New Hampshire to 100 percent in the District of Columbia. In the District of Columbia, Pre-K is offered on the same schedule as school for older children (1068 contact hours per child during the school year); in Florida, the state with the next highest level of enrollment (89 percent of four-year-olds), Pre-K is available on a part- time basis only (540 contact hours during the school year; Barnett et al. 2013).
Only a few states provide both high Pre-K access and high-quality preschool education. The National Institute for Early Childhood Education (NIEER) assesses states on ten indicators of Pre-K quality, including measures such as class size, minimum qualification standards for teachers and teacher assistants, supports for vision- or hearing-impaired children, and site visits by educational authorities to check on standards (Barnett et al. 2013). As Barnett et al. emphasize, however, these quality indicators measure program design features, not quality in the actual delivery of Pre-K education.
■ In the District of Columbia, all four-year-olds have access to publicly provided preschool education.21 The District of Columbia also meets eight of ten Pre-K quality indicators. Other states with high rates of access and high quality ratings are Oklahoma (87 percent access and a quality rating of 9); West Virginia (85 percent access and a quality rating of 8); and Georgia (66 percent access and a quality rating of 8).
■ There are four states—Alabama, Alaska, North Carolina, and Rhode Island—that meet all ten quality standards, but in all of these states, coverage rates are 35 percent or less.
■ The states of Florida (89 percent) and Texas (62 percent) are among the top ten states for access to Pre-K, but Florida meets only three and Texas only two of ten quality standards.
■ Access to public preschool education is lowest in New Hampshire (12 percent of four-year-olds). Other states with low access are Hawaii, Idaho, and Utah at 13 percent each. These states have also not implemented any of the quality indicators assessed by the National Institute for Early Education Research (Barnett et al. 2013).
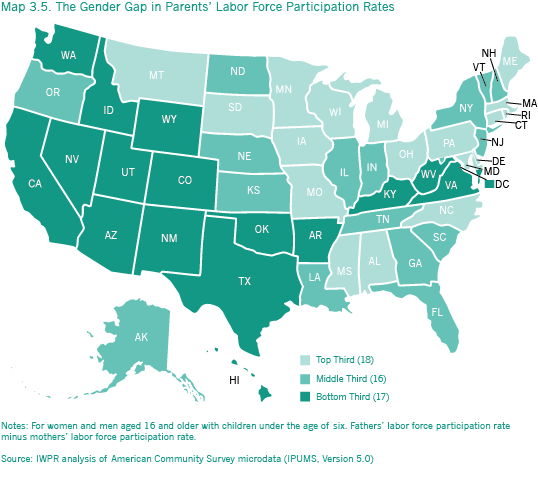
The Gap in Mothers’ and Fathers’ Labor Force Participation Rates
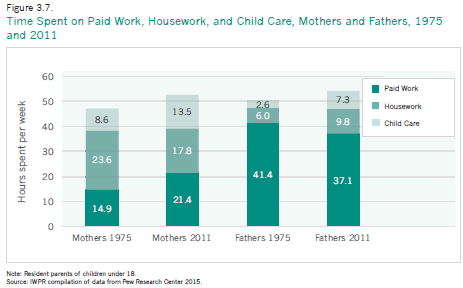
During the past four decades, the labor force participation rate for mothers of children under six has more than doubled, from just under a third (32.1 percent) in 1970 to just over two thirds (67.1 percent) in 2013 (IWPR 2015a). During the same period, the labor force participation rate of fathers hardly changed at all, falling from 97.9 percent in 1970 to 94.4 percent in 2013. Trends in the allocation of time between paid work, child care,
and housework between 1975 and 2011 show that both mothers and fathers of young children now spend more time on these three activities than they did forty years ago (Figure 3.7). Yet, while mothers spend more time in paid work and fathers more time on housework and child care, overall mothers still do the large majority of family work and fathers still do the majority of paid work.
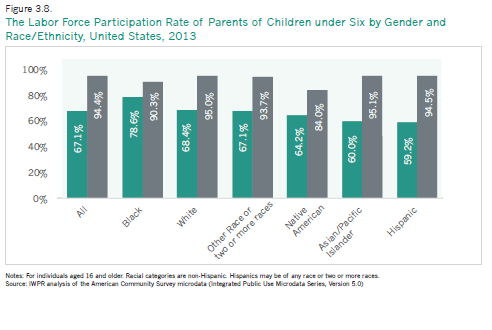
There are substantial differences in the likelihood that mothers of young children are in the workforce between women of the largest racial and ethnic groups. The labor force participation rates of Black mothers of young children are substantially higher than among comparable mothers of any other racial/ethnic background. Seventy-nine percent of black mothers of children under the age of six are in the workforce, more than ten percentage points higher than the rate for all women (67.1 percent; Figure 3.8). Hispanic and Asian/Pacific Islander women have the lowest rates (at 59.2 and 60.0 percent respectively). Fathers are more likely to be in the workforce than mothers among all of the major racial and ethnic groups, and there is less variation between groups.
Asian/Pacific Islanders and white men have the highest rates (95.1 and 95.0 percent respectively), and Native American fathers have the lowest rate (84 percent). The gap in parents’ labor force participation rates is smallest for blacks and largest for Asians/Pacific Islanders and Hispanics (Figure 3.8).
Mothers of children under six are less likely than fathers to be in the labor force in all states, but the rates of mothers’ labor force participation vary considerably across the states. Only 53 percent of mothers in Utah are in the workforce, compared with 80 percent of mothers in South Dakota. There is a much smaller range for men’s participation rates, ranging from 89 percent in Maine to 98 percent in Wyoming (Appendix Table B3.4).
■ Utah has the largest gender gap in parental labor force participation (42.7 percentage points). Eight other states—Arizona, California, Hawaii, Idaho, Texas, Washington, West Virginia, and Wyoming—have gaps that are larger than 30 percentage points.
■ Maine has the lowest gender gap (13.7 percent). Three other states—South Dakota (14.5 percentage points), Iowa (18.6 percentage points), and Wisconsin (19.6 percentage points)—have gaps that are smaller than 20 percentage points (Appendix Table B3.4).
Given the high costs of quality child care, it is perhaps not surprising that many families reduce their time in the workforce when children are young, particularly when they have more than one child. In dual-earner families, women’s lower earnings provide an economic rationale for the (lower-earning) mother rather than the (higher-earning) father to be the one to leave paid work and focus on family care. Yet, having sustained time out of employment reduces women’s earnings progression and over a lifetime, and this interruption can cost women dearly through lower earnings, fewer advancement opportunities, and reduced pension and retirement assets (Rose and Hartmann 2006).
Methodology
1 A primary or co-breadwinner is defined as a single mother, or as a married mother with children under 18 who earns at least 40 percent of a couple’s total earnings; see Appendix A3 for a more detailed discussion of the breadwinner analysis.
2 The large majority of family caregivers aged 50 to 64 are employed (Metlife 2011).
3 In this report, the term “family caregiver” will be used to describe someone providing unpaid care to a family member. A person paid to provide such care will be described as a “domestic care worker.”
4 Reviews of the research on parental leave are available in Gault et al. 2014; Earle, Mokomane, and Heymann 2011; and Winston 2014.
5 On February 25, 2015, the U.S. Department of Labor issued a “Final Rule” on the FMLA to clarify that legally married same-sex spouses are entitled to take FMLA leave to care for their spouse irrespective of the legal recognition of same-sex marriage in their state of residence (U.S. Department of Labor, WHD 2015a).
6 Benefits provided through the TDI State Fund in New York, however, are very low, at an average wage replacement of only $170 per week (U.S. Social Security Admin- istration 2014, Table 9c1).
7 Washington also passed the State Family Leave Act in 2007, but its implementation has been indefinitely postponed.
8 Estimates vary according to the source of data and the type of caregiving that is considered, but all find women to be the majority of those who provide unpaid family care; see Bianchi, Folbre, and Wolf 2012; Lee and Tang 2013; National Alliance for Caregiving and AARP 2009a and b; Spillman, Wolff, Freedman, and Kasper 2014; U.S. Bureau of Labor Statistics 2013a.
9 According to a 2014 study, 55 percent of employed adults aged 18 and older had provided care for at least one person aged 65 or older during the last five years; 8 percent only provided care for someone aged 50 to 64; and 37 percent had not provided care for someone aged 50 or older (Matos 2014).
10 The ACS defines a person with a disability as someone who has one or more of the following: hearing difficulty; vision difficulty; cognitive difficulty (having difficulty remembering, concentrating, or making decisions because of a physical, mental, or emotional problem); having serious difficulty walking or climbing stairs; having difficulty bathing or dressing; independent living difficulty (having difficulty doing errands alone such as visiting a doctor’s office or shopping because of a physical, mental, or emotional problem; U.S. Census Bureau 2012b). A similar methodology is used by the Bureau of Labor Statistics in the CPS (U.S. Bureau of Labor Statis- tics 2012).
11 To our knowledge, for example, there are no available state-by-state data to allow a comparison of respite care policies for caregivers.
12 In states without nurse delegation, long-term support services (such as providing an insulin injection to someone with diabetes) have to be provided by a registered nurse when an agency is used to provide such services, increasing the costs of buying such care. The same restrictions do not apply when a family directly hires a caregiver.
13 This definition of breadwinners (all single mothers and married mothers who contribute at least 40 percent of a couple’s joint earnings) is used for the remainder of this report; the wage gap means that a woman earns only 78 percent of a man’s earnings for full-time year round work; thus, when both work full-time, using median earnings, a woman’s earnings will only be approximately 40 percent of the joint earnings. A subset of women are the primary breadwinners in their families (the sole provider or earning more than half of a couple’s joint earnings, a definition used by Wang, Parker, and Taylor, 2013) in four of ten families with children under 18 (IWPR 2015a).
14 The U.S. Department of Labor advises that breastfeeding rights apply to all workers who are covered by the Fair Labor Standards Act (hourly paid and nonsupervi- sory workers) and should be made available to all workers. Small employers (with fewer than 50 workers) may be exempt from the rule if they can demonstrate that implementing it would impose undue hardship (U.S. Department of Labor Wages and Hours Division 2015b).
15 The choice of indicators is partly guided by data availability as well as by the desire to select only a few indicators to describe the terrain.
16 To be eligible under federal parameters, children must be under 13 years of age (under 19 if they have a disability) and must live in a household with income below 85 percent of the state’s median household income, with parents who are employed or in training or education (depending on state policies); see ASPE (2015) for more detailed discussion of how eligibility is defined. States have the flexibility to use more restrictive eligibility criteria; in 2013 income eligibility rules in 14 states excluded any families with incomes above 150 percent of poverty (Schulman and Blank 2013).
17 State data available at www.statusofwomendata.org.
18 States typically operate a variety of preschool programs with differing rules, making it difficult to assess the average hours offered to children in ECE in different states (Barnett et al. 2013; Holt 2014).
19 The share of enrolled children as a percent of all children draws on U.S. Census estimates of four-year-olds; in the District of Columbia, Census estimates may slightly underestimate the number of four-year-olds in the District, leading to a potential overestimate of the share of children in publicly funded preschool education (communication with Megan Carolan, NIEER, June 2014).