The Economic Status of Women in the States
This Fact Sheet presents findings from analysis of the Employment & Earnings Index and Poverty & Opportunity Index of The Status of Women in the States series, a comprehensive project that presents and analyzes data for all 50 states and the District of Columbia. The state grades, rankings, and data provided on these two measures of women’s economic status provide critical information to identify areas of progress for women in states across the nation and pinpoint where additional improvements are still needed. The state-by-state grades are based on composite indices first developed by the Institute for Women’s Policy Research in 1996. For a complete discussion of data sources and methodology, and to find fact sheets on the economic status of women in each state, please visit the interactive Status of Women in the States website at statusofwomendata.org.
Best and Worst States on Employment & Earnings, 2018

The grades on the Status of Women in the States Employment & Earnings Index measure states on women’s earnings, the gender wage gap, women’s labor force participation, and women’s representation in professional and managerial occupations. See Table 1 for each state’s overall scores, along with the data and rankings for each state on each of the component indicators.
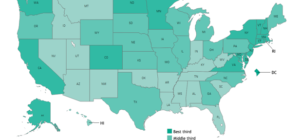
Map 1. How the States Measure Up: Employment & Earnings Composite Index

Note: For composite methodology and sources, go to https://statusofwomendata.org/explore-the-data/methodology.
Best States for Women: Employment & Earnings
The District of Columbia, Maryland, and Massachusetts once again hold the top three places on the Employment & Earnings Index; these three states were the top three the last time the index was calculated in 2015. Sixteen states saw improvements to their grade since 2015,[1] with South Dakota seeing the greatest improvement among the states, earning a C+ in 2018, up from a D in 2015, boosted primarily by sharp increases in the share of women in professional or managerial occupations (moving from a ranking of 49 to 18) and in median annual earnings (moving from a ranking of 48 to 38). Twenty-four states received the same grade as in 2015 and 11 states received a worse grade.
The best states for women on key Employment & Earnings indicators include:
- Earnings: Women working full-time, year-round have the highest earnings in the District of Columbia, where women’s median annual earnings are $65,000. Connecticut, Maryland, Massachusetts, and New Jersey are tied for second, with women in those states earning $50,000 at the median.
- Wage Gap: Women in California, New York, and Florida face narrower wage gaps, and higher earnings ratios, than women in other states, earning 90 percent, 89.6 percent, and 87.5 percent, respectively, of what men earn in those states.
- Labor Force Participation: District of Columbia, North Dakota, and Minnesota have the highest shares of women in the labor force at 67.4 percent, 66.4 percent, and 65.7 percent, respectively.
- Women in Professional/Managerial Occupations: District of Columbia, Massachusetts, and Maryland—the states that received top grades overall on the Employment & Earnings Index—have the greatest shares of employed women in professional or managerial occupations, at 60.7 percent, 49.4 percent, and 47.8 percent, respectively.
Worst States for Women: Employment & Earnings
Mississippi, West Virginia, and Idaho are the worst states for women on the Employment & Earnings Index, all receiving the lowest grade, F.
The worst states for women on key Employment & Earnings indicators include:
- Earnings: Women have the lowest earnings in Mississippi ($31,300 median annual earnings), Arkansas ($32,000), and Montana ($33,000).
- Wage Gap: Women in Louisiana, Utah, and Montana face the widest wage gaps and the lowest earnings ratios, earning 69 percent, 70 percent, and 70.2 percent, respectively, of what men earn in those states.
- Labor Force Participation: The share of women in the workforce is lowest in West Virginia, Alabama, and Mississippi, where just over half of women participate in the labor force, at 50.2 percent, 53.2 percent, and 53.4 percent, respectively.
- Women in Professional/Managerial Occupations: Nevada, Idaho, and Hawaii have the lowest shares of women in professional or managerial occupations, at 31.7 percent, 36.7 percent, and 37 percent.
Best and Worst States on Poverty & Opportunity, 2018

The Status of Women in the States Poverty & Opportunity Index measures states based on the percent of women living above poverty, the percent with health insurance, the percent having a college education, and the percent of businesses owned by women. See Table 2 for each state’s overall scores, along with the data and rankings for each state on each of the component indicators.
Map 2. How the States Measure Up: Poverty & Opportunity Composite Index

Note: For composite methodology and sources, go to https://statusofwomendata.org/explore-the-data/methodology.
Best States for Women: Poverty & Opportunity
Although Maryland, the District of Columbia, and Massachusetts received the top grades on the Poverty & Opportunity Index in 2018, each of those state’s grades are lower than they were in 2015, when the District of Columbia received an A- and Maryland and Massachusetts each received a B+.
The best states for women on key Poverty & Opportunity indicators include:
- Poverty: New Hampshire, Connecticut, Maryland, and New Jersey have the highest rates of women living above poverty in the country at 89.2 percent, 88.4 percent, 88.1 percent, and 88.1 percent, respectively.
- Health Insurance Coverage: More nonelderly women have health insurance in Massachusetts (97.5 percent), Vermont (96.5 percent), and the District of Columbia (96.4 percent) than in any other state. In 2013, only five jurisdictions (District of Columbia, Hawaii, Massachusetts, Minnesota, and Vermont) saw the share of women with health insurance exceed 90 percent. In 2016, the number of states with at least 90 percent of women having health insurance jumped to 29, likely due to implementation of the Affordable Care Act. The states that saw the greatest increase in the share of women with health insurance were New Mexico and West Virginia, which each saw a 15 percentage point increase, and Kentucky, which saw a 14 percentage point increase.
- Education: The District of Columbia, Massachusetts, and Colorado have the highest shares of women with at least a bachelor’s degree, with more than half (56.3 percent) of women in D.C. holding a BA or higher.
- Business Ownership: Women are more likely to own their own businesses in the District of Columbia, Georgia, and Maryland, with the share of businesses owned by women in those states at 42.7 percent, 40.5 percent, and 39.3 percent, respectively.
Worst States for Women: Poverty & Opportunity
Missisippi is the only state to receive an F on the Poverty & Opportunity Index, with Louisiana, Kentucky, West Virginia, and Arkansas each receiving a D-. Sixteen states received lower grades than in 2015, while 5 states received higher grades, and 30 states received the same grade.
The worst states for women on key Poverty & Opportunity indicators include:
- Poverty: Women are more likely to live in poverty in the District of Columbia, Mississippi, and Louisiana, where the share of women living above poverty are 73.3 percent, 78.1 percent, and 78.2 percent, respectively.
- Health Insurance Coverage: Although every state saw an increase in the percentage of women with health insurance since 2015, women are least likely to have health insurance in Texas, Oklahoma, and Alaska, where the share of women with coverage is 78.1 percent, 81.5 percent, and 82.4 percent, respectively.
- Education: Less than one in four women aged 25 or older in West Virginia (21.7 percent), Arkansas (22.9 percent), and Nevada (23.8 percent) has at least a bachelor’s degree.
- Business Ownership: Women in South Dakota, New Hampshire, and North Dakota have the lowest shares of business ownership, with the share of businesses owned by women in those states at 29.2 percent, 29.3 percent, and 29.8 percent, respectively. Men own the vast majorities of businesses in these states.
Table 1. How the States Measure Up: Women’s Status on the Employment & Earnings Composite Index and Its Components, 2016

Note: National data for women’s median annual earnings and the earnings ratio include those aged 15 and older. All other data include those aged 16 and older. Source: The national data for women’s median annual earnings and the earnings ratio are calculated using Current Population Survey data, the official dataset for national earnings. All other data are IWPR analyses of American Community Survey microdata (Integrated Public Use Microdata Series, Version 6.0).
Table 2. How the States Measure Up: Women’s Status on the Poverty & Opportunity Composite Index and Its Components, 2016

Source: Data on women-owned businesses are from the U.S. Department of Commerce’s 2012 Survey of Business Owners accessed through American FactFinder. All other data are IWPR analyses of American Community Survey microdata (Integrated Public Use Microdata Series, Version 6.0).
About the Institute for Women’s Policy Research
The Institute for Women’s Policy Research (IWPR) conducts and communicates research to inspire public dialogue, shape policy, and improve the lives and opportunities of women of diverse backgrounds, circumstances, and experiences. The Institute’s research strives to give voice to the needs of women from diverse ethnic and racial backgrounds across the income spectrum and to ensure that their perspectives enter the public debate on ending discrimination and inequality, improving opportunity, and increasing economic security for women and families. The Institute works with policymakers, scholars, and public interest groups to design, execute, and disseminate research and to build a diverse network of individuals and organizations that conduct and use women-oriented policy research. IWPR’s work is supported by foundation grants, government grants and contracts, donations from individuals, and contributions from organizations and corporations. IWPR is a 501(c)(3) tax-exempt organization that also works in affiliation with the Program on Gender Analysis in Economics at American University. Maybe add the web site here. For more information, visit iwpr.org.
About The Status of Women in the States
This Fact Sheet is a part of the Institute for Women’s Policy Research’s series on the status of women across the United States, begun in 1996. The Status of Women in the States project uses data from U.S. government and other sources to analyze women’s status in each state and the United States overall, rank and grade states on a set of indicators for six topical areas, and provide additional data on women’s status in states across the nation. The Institute for Women’s Policy Research has published individual reports on the status of women since 1996 in each state and the District of Columbia. The reports have been used to highlight women’s progress and the obstacles they continue to face and to encourage policy and programmatic changes that can improve women’s opportunities. For more information, visit statusofwomendata.org.
[1] Cynthia Hess, Jessica Milli, Jeff Hayes, Ariane Hegewisch, Yana Mayayeva, Stephanie Roman, Julie Anderson, and Justine Augeri. 2015. The Status of Women in the States: 2015. Report, IWPR #R400. Washington, DC: Institute for Women’s Policy Research. <https://iwpr.org/publications/the-status-of-women-in-the-states-2015-full-report/> (accessed March 14, 2018).