In this section:
Employment and Earnings Composite Score
Trends in Employment and Earnings
Earnings and the Gender Wage Gap
- Median Annual Earnings
- The Gender Earnings Ratio
- The Employment and Earnings of Older Women
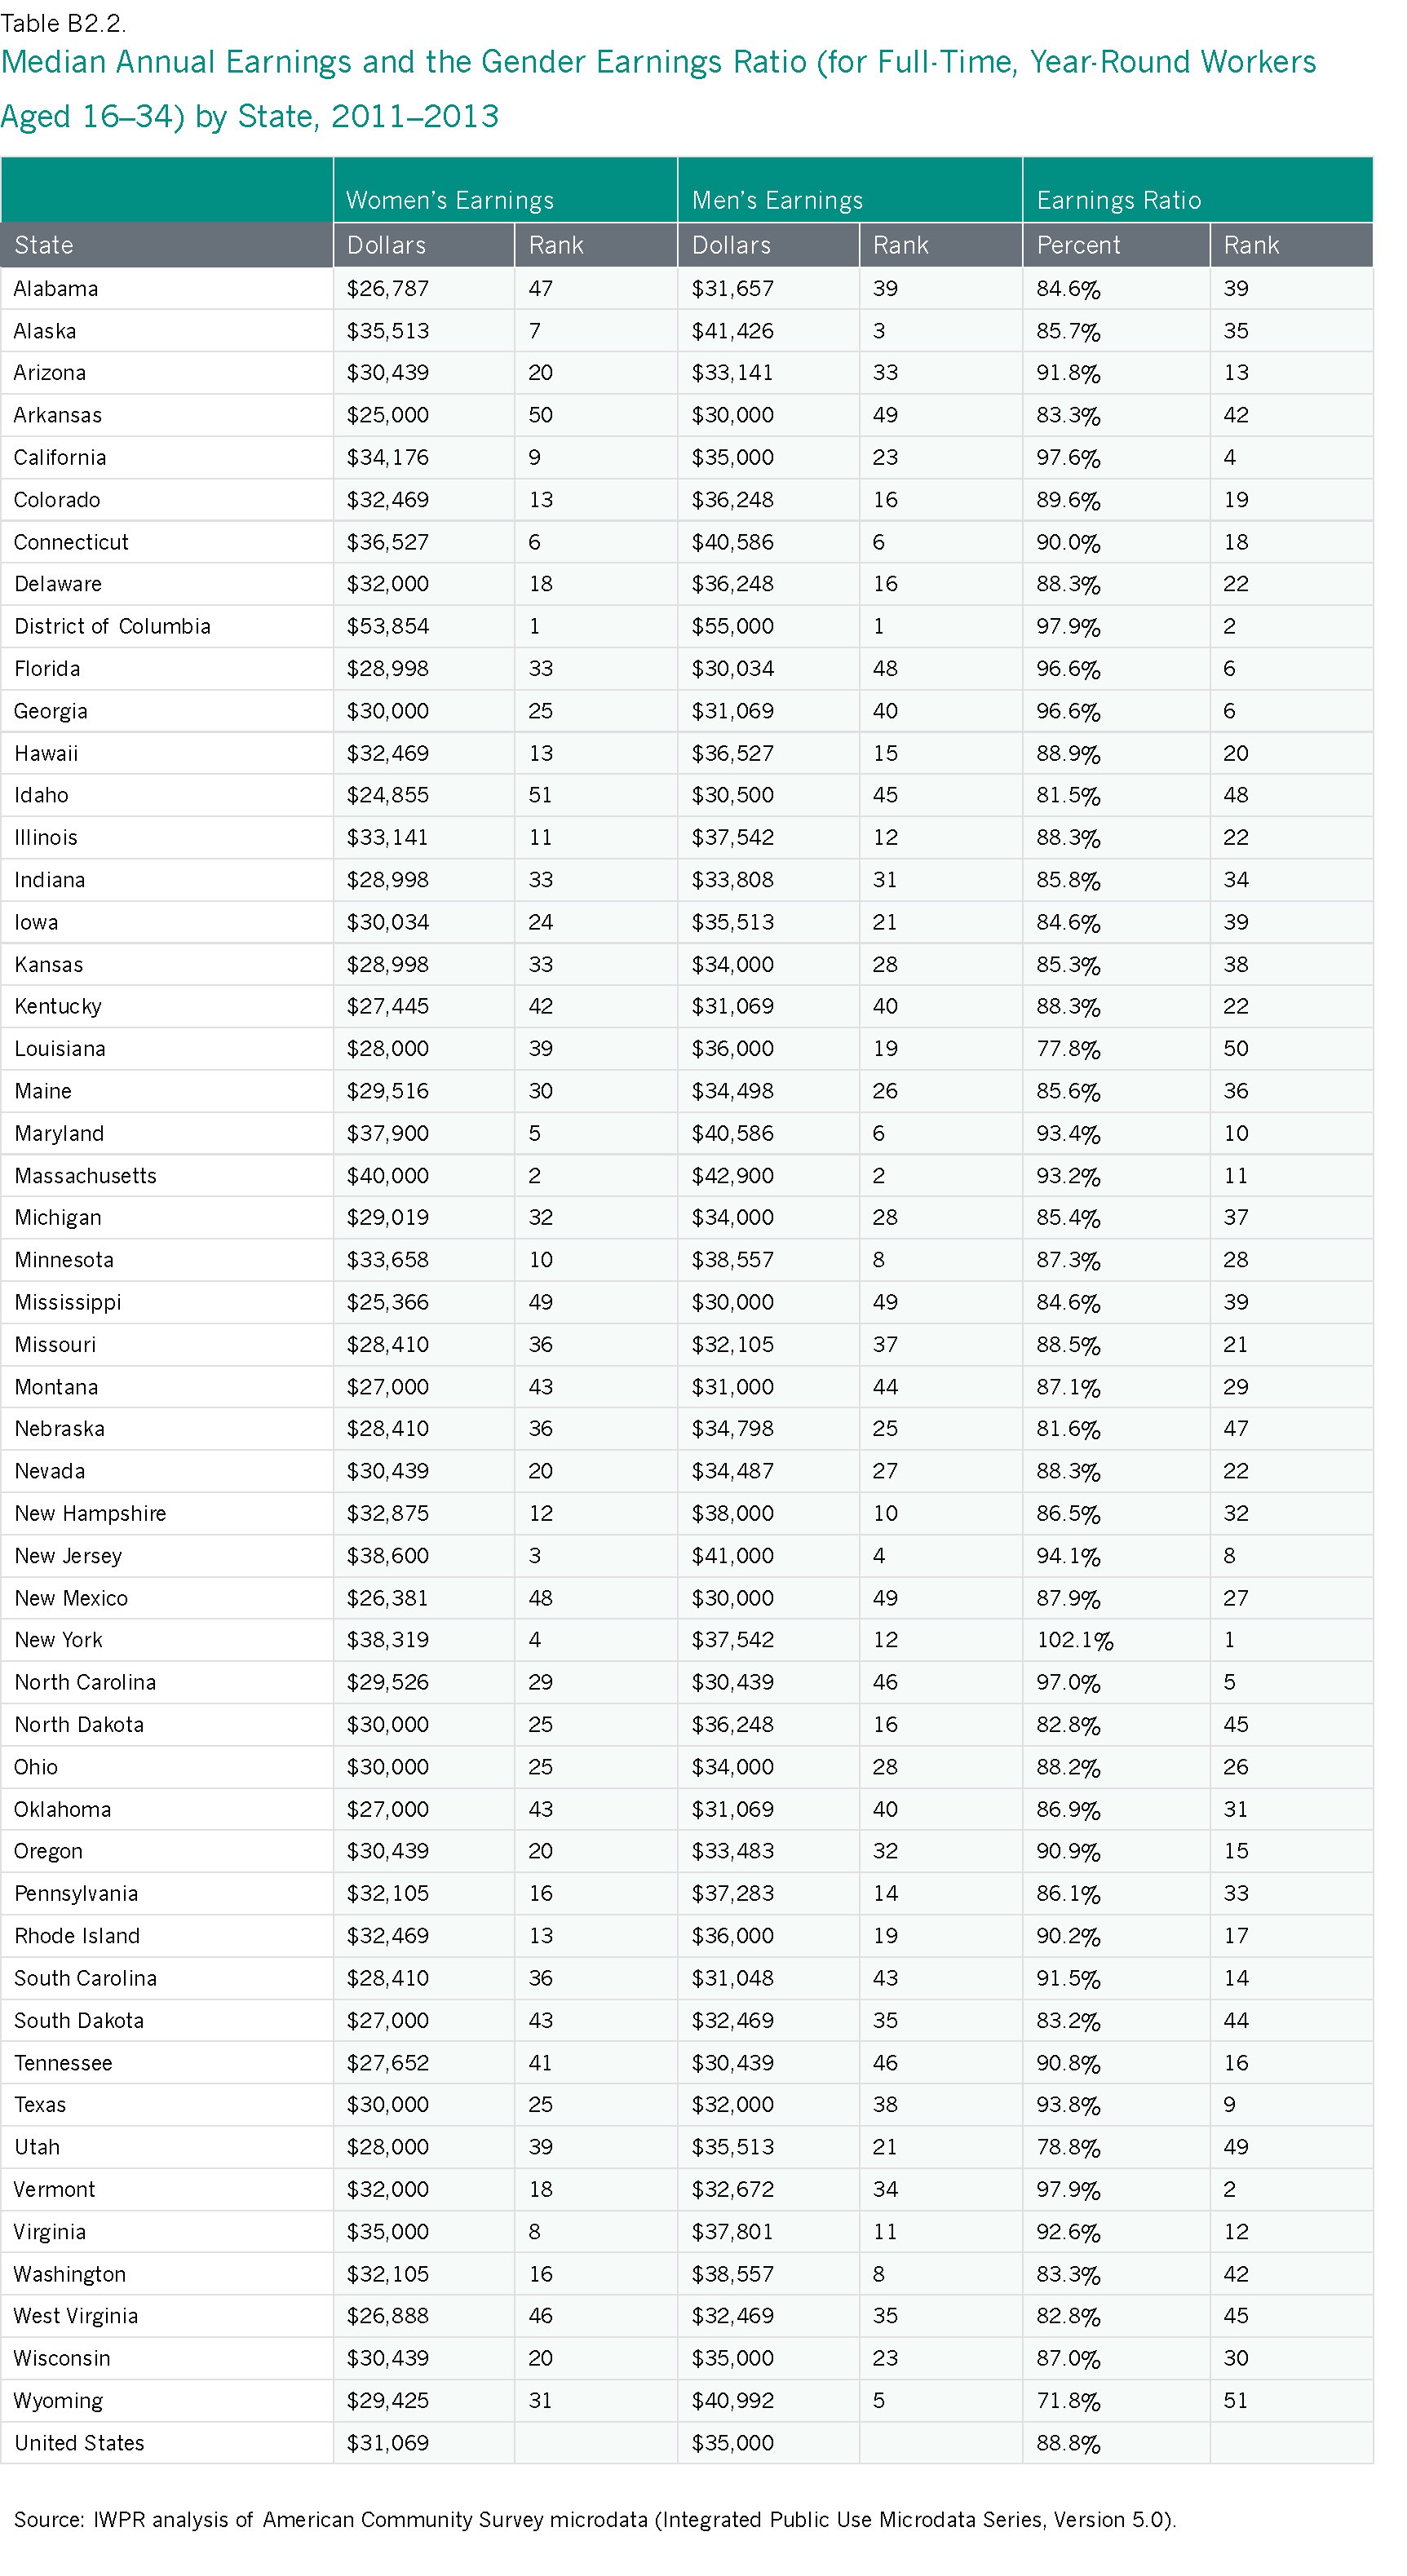
- The Employment and Earnings of Millennials
- Earnings and the Gender Wage Gap for Women of Color
- The Earnings Ratio by Educational Attainment
- State Statutes That Address the Gender Wage Gap
- Cumulative Losses from the Gender Wage Gap
- Gender Inequality in Low and High Paid Jobs
- The Union Advantage for Women
Women’s Labor Force Participation
- Part-Time Work
- Unemployment
- The Employment and Earnings of Immigrant Women
- The Employment and Earnings of Women with Disabilities
Gender Differences in Employment by Industry
Gender Differences Across Occupations
Employment and Earnings: Introduction
Women make up nearly half of the U.S. workforce, and their earnings are essential to the economic security of families across the nation. Yet, gender equality at work remains elusive. Women who work full-time, year-round still earn only 78 cents on the dollar compared with men, and during the last decade little improvement has been made in closing the gender wage gap (DeNavas-Walt and Proctor 2014). The glass ceiling persists, and occupational segregation—the concentration of women in some jobs and men in others—remains a stubborn feature of the U.S. labor market (Hegewisch et al. 2010).
These national trends show up in states across the nation. This report examines women’s earnings and the gender wage gap, women’s labor force participation, and the occupations and industries in which women work. It also considers areas where women have experienced progress toward gender equity in the workforce and places where progress has slowed or stalled.
The Employment and Earnings Composite Score
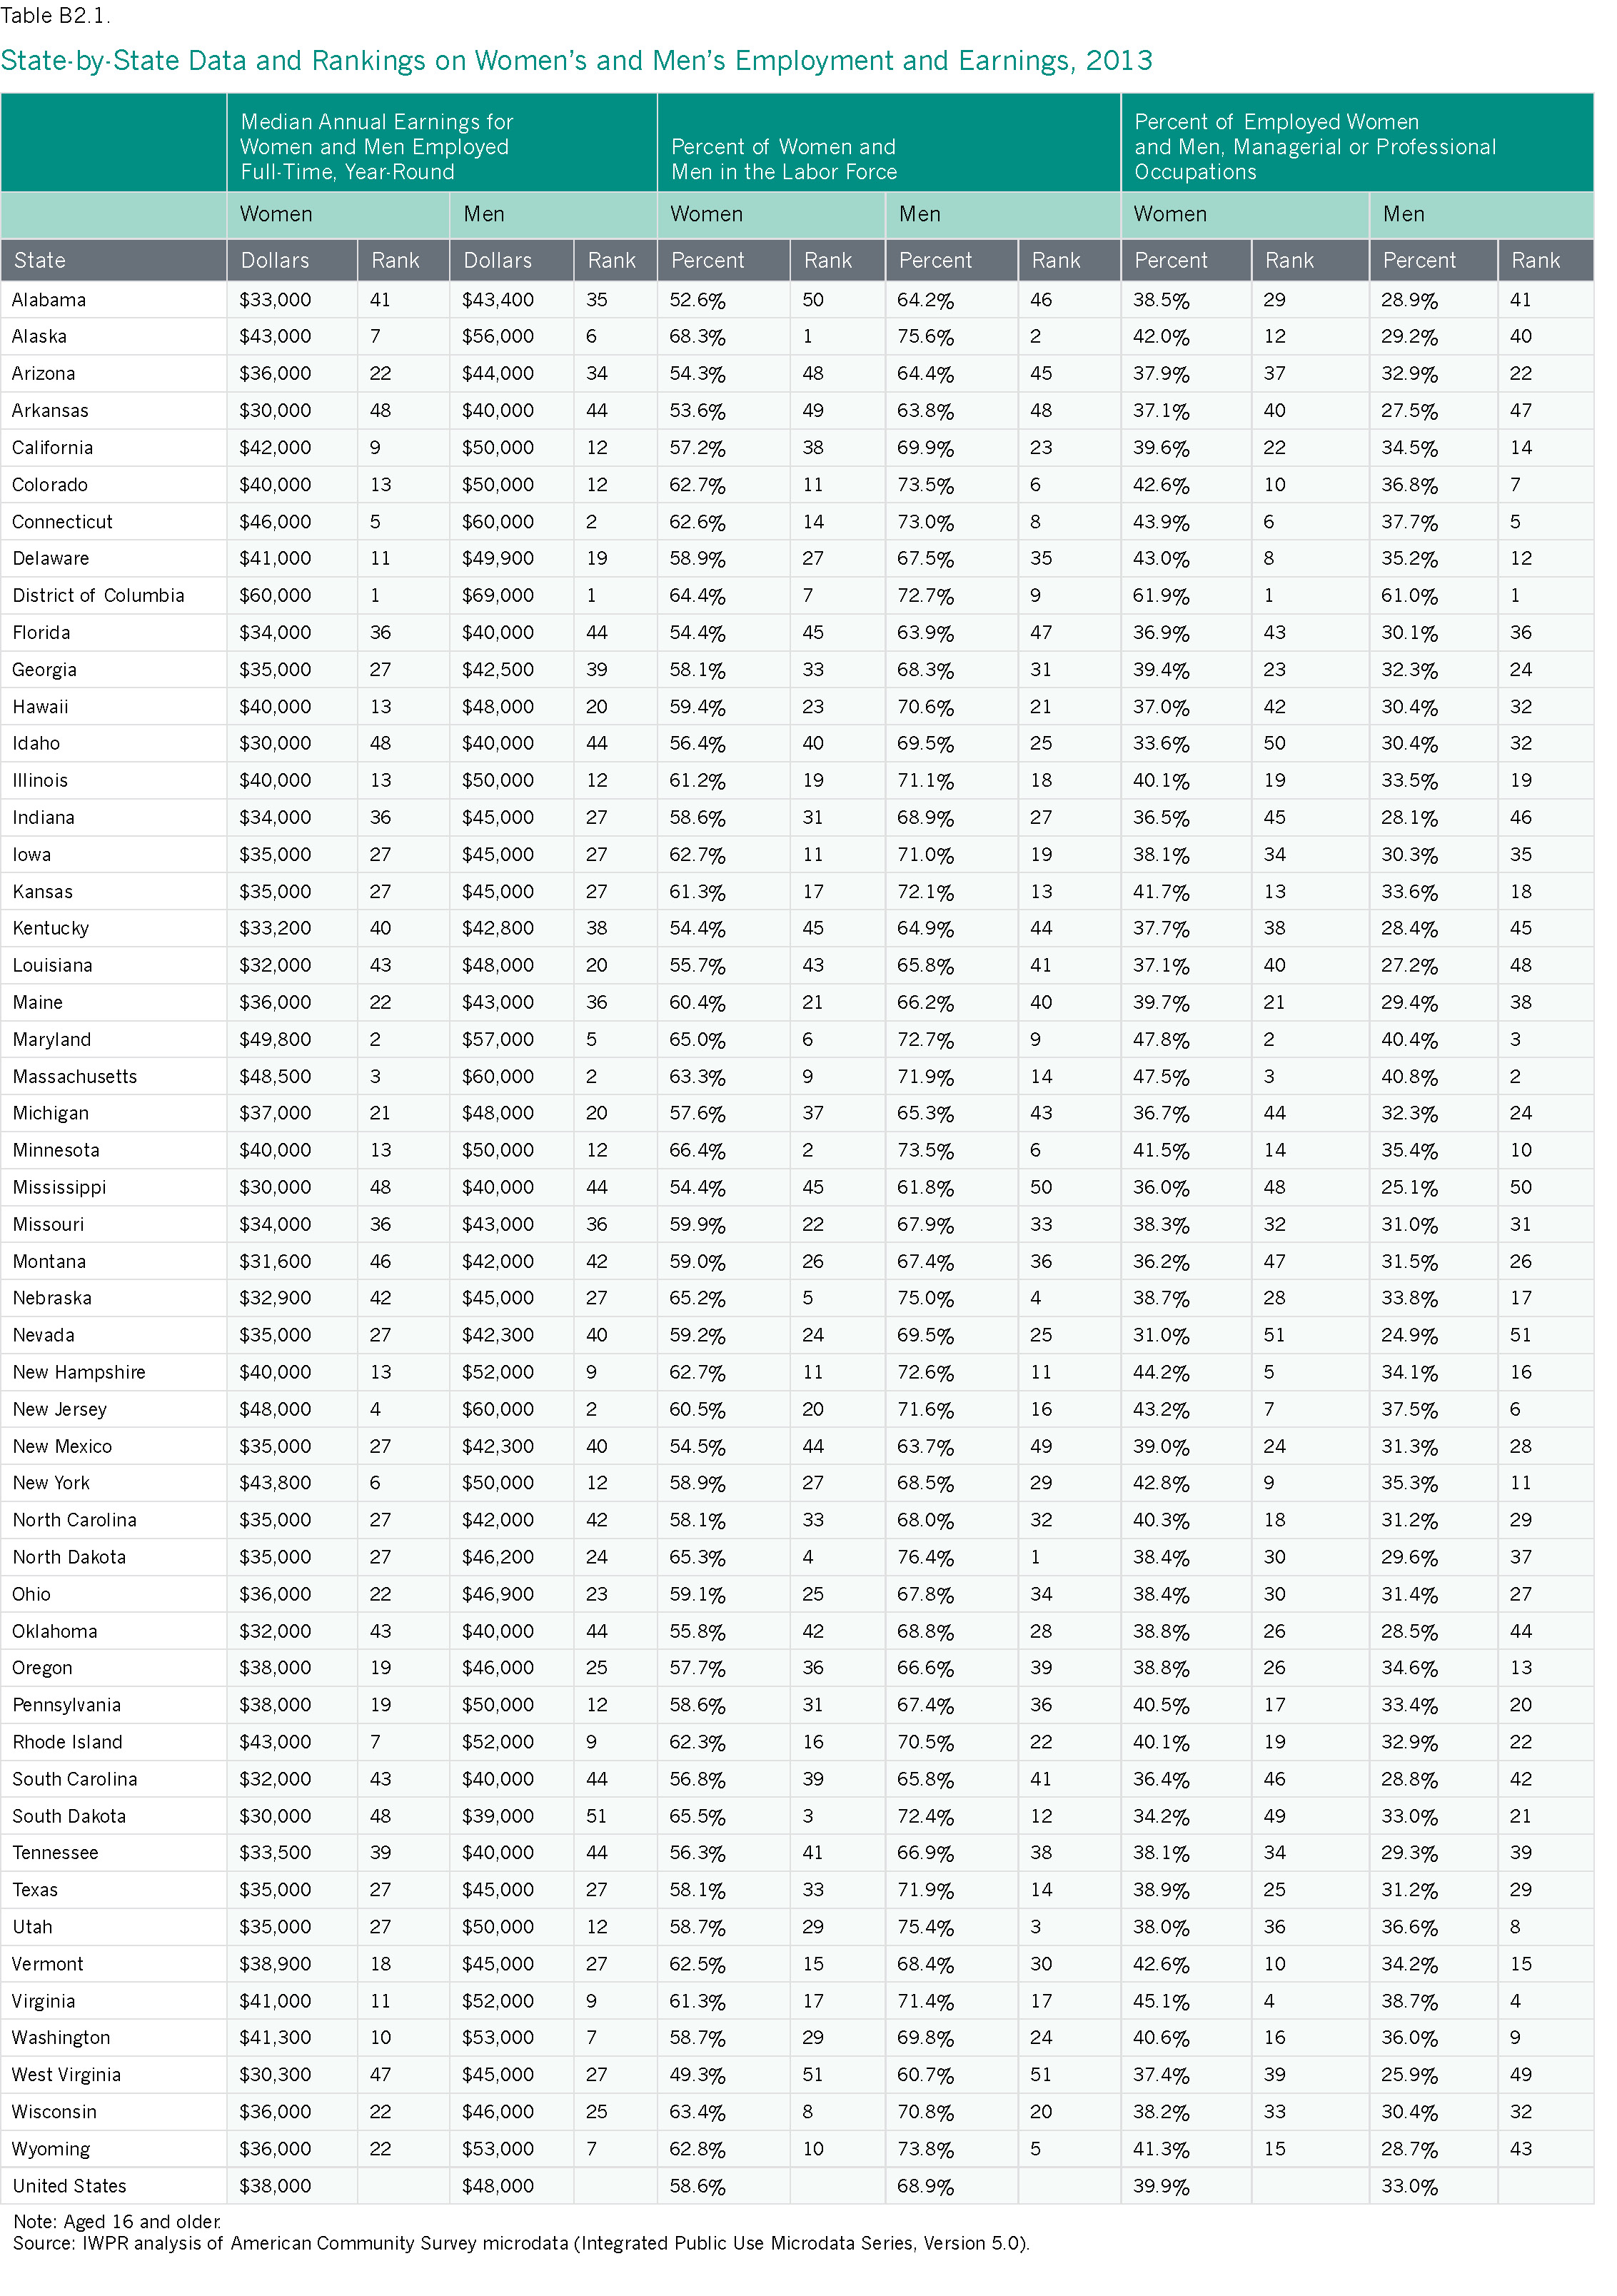
The employment and earnings composite index compares the states’ performance on four key component indicators of women’s status in the domain of employment and earnings: median annual earnings for women who work full-time, year-round; the gender earnings ratio among full-time, year-round workers; women’s labor force participation; and the percent of employed women who work in managerial or professional occupations. Composite scores ranged from a high of 5.33 to a low of 3.43, with the higher scores reflecting a stronger performance in the area of employment and earnings (Table 2.1).
- The District of Columbia has, by far, the highest score on the Employment and Earnings Composite Index (Table 2.1). The District ranks in the top ten on all four component indicators and is first for women’s earnings and the percent of employed women in managerial or professional occupations.
- West Virginia has the lowest ranking on the Employment and Earnings Composite Index. It ranks in the bottom ten on three of the four indicators and is last for the percent of women in the labor force and second to last for the gender earnings ratio.
- In general, women in the Northeast and Mid-Atlantic regions fare the best on the Employment and Earnings Composite Index (Table 2.1; Map 2.1). Along with the District of Columbia, seven other states from these regions—Connecticut, Maryland, Massachusetts, New Jersey, New York, Vermont, and Rhode Island—are all in the top eleven. Alaska, Minnesota, and Virginia also rank in the top eleven; Minnesota and Rhode Island tied for tenth place.
- The Southern states have poor scores on the Employment and Earnings Composite. In addition to West Virginia, six other Southern states—Alabama, Arkansas, Kentucky, Louisiana, Mississippi, and South Carolina—are in the bottom ten. They are joined by Idaho, Montana, and South Dakota.
- The District of Columbia is the only jurisdiction to receive an A on the Employment and Earnings Composite Index. No state received an A-, and two states—Maryland and Massachusetts—received a B+. Arkansas, Mississippi, Louisiana, Idaho, and West Virginia all received an F (for information on how grades were determined, see Methodology).
Best and Worst States on Women’s Employment and Earnings
| Best States | Worst States | ||||||
|
|
Rank |
Grade |
|
Rank |
Grade |
||
District of Columbia |
1 |
A |
West Virginia |
51 |
F |
||
Maryland |
2 |
B+ |
Idaho |
50 |
F |
||
Massachusetts |
3 |
B+ |
Louisiana |
49 |
F |
||
New Jersey |
4 |
B |
Mississippi |
48 |
F |
||
Connecticut |
5 |
B |
Arkansas |
47 |
F |
||
Table 2.1 How the States Measure Up: Women’s Status on the Employment and Earnings Composite and Its Components
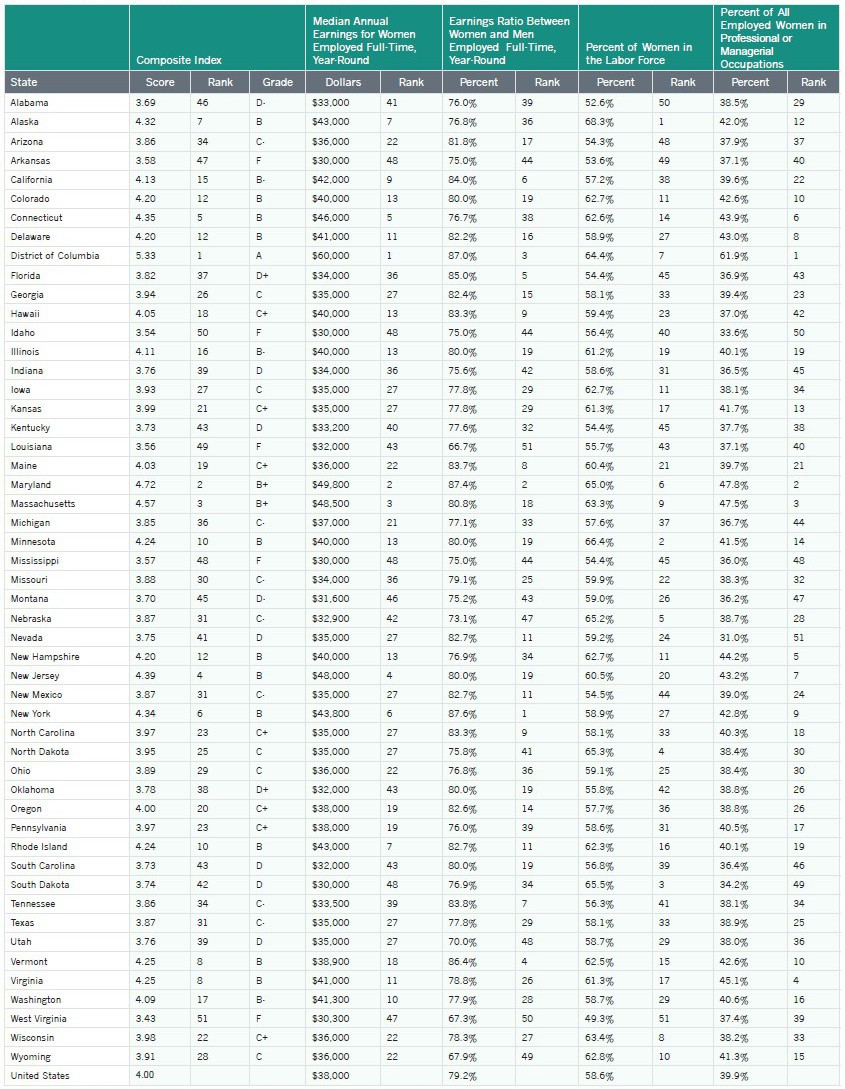 Note: Aged 16 and older.
Source: IWPR analysis of American Community Survey microdata (Integrated Public Use Microdata Series, Version 5.0).
Trends in Employment and Earnings
Women’s status in the area of employment and earnings has improved on two indicators since the publication of IWPR’s last national report on the status of women, the 2004 Status of Women in the States, and remained unchanged or declined on two others. Women’s median annual earnings for full-time, year-round work in 2013 ($39,157) were nearly identical to their earnings for similar work in 2002 ($39,108 when adjusted to 2013 dollars).1 The gender earnings ratio improved during this time from 76.6 to 78.3 percent (DeNavas-Walt and Proctor 2014), narrowing the gender wage gap by 1.7 percentage points, and the share of women working in professional or managerial occupations grew from 33.2 to 39.9 percent. Women’s labor force participation rate, however, declined from 59.6 in 2002 to 57.0 percent in 2014 (IWPR 2004; U.S. Bureau of Labor Statistics 2015a).2
- On the composite score for women’s employment and earnings, 30 states have either gained ground or experienced no change. The jurisdictions experiencing the largest gains are New York and the District of Columbia, whose composite scores increased by 8.2 and 7.0 percent, respectively. New York’s ranking improved from 19th to 6th place between the 2004 and 2015 releases, and the District of Columbia ranked first in both years.
- Among states that have declined, Missouri experienced the biggest loss, with a 6.5 percent decrease in its composite score. This decline is considerably higher than the state with the second largest loss, Arizona, whose score decreased by 3.0 percent. Between the 2004 and 2015 data releases, Missouri declined in the rankings from 12th to 30th place, and Arizona fell from 22nd to 34th place.
Earnings and the Gender Wage Gap
Median Annual Earnings
Women’s median annual earnings vary considerably across states (see Table 2.1).
- The District of Columbia ranked first in the nation for the median annual earnings of women working full-time, year-round in 2013. Women in the nation’s capital had considerably higher earnings ($60,000) than women in the second- and third-ranking jurisdictions, Maryland and Massachusetts, where women earned $49,800 and $48,500, respectively.3
- In Arkansas, Idaho, Mississippi, and South Dakota, women have median annual earnings of $30,000, the lowest in the nation. Other states that rank in the bottom ten on this indicator include Louisiana, Montana, Nebraska, Oklahoma, South Carolina, and West Virginia.
During the last thirty years, men’s real earnings in the United States have remained essentially the same, while women’s have grown, albeit from a much smaller base. Between 1980 and 2013, after adjusting for inflation, real median earnings for women’s full-time, year-round work grew nationally from $30,138 to $39,157, while men’s decreased slightly from $50,096 to $50,033 (DeNavas-Walt and Proctor 2014).4 Among women, the growth in real median annual earnings took place in the 1980s and 1990s; since the early 2000s, women’s earnings, like men’s, have stagnated.
Changes to women’s and men’s real earnings vary across the states, however. IWPR analysis of the 1980, 1990, and 2000 Decennial Censuses (for the calendar years 1979, 1989, and 1999) indicates that between 1979 and 1999, women’s real earnings increased in all but three states (48) while men’s increased in only 18. Between 1999 and 2013, 27 states had positive earnings growth for women, with the strongest growth in North Dakota. During this time, men’s real earnings grew in only seven states (Figure 2.1). As men’s real earnings have stagnated or fallen, women’s earnings have become increasingly important to family economic security. As of 2012, 29 percent of women in married couples where both spouses work had annual earnings that were higher than their husbands’, an increase of 11 percentage points since 1987 (U.S. Bureau of Labor Statistics 2014a).
Figure 2.1. Change in Real Median Annual Earnings by Gender (Full-Time, Year-Round Workers), 1999–2013
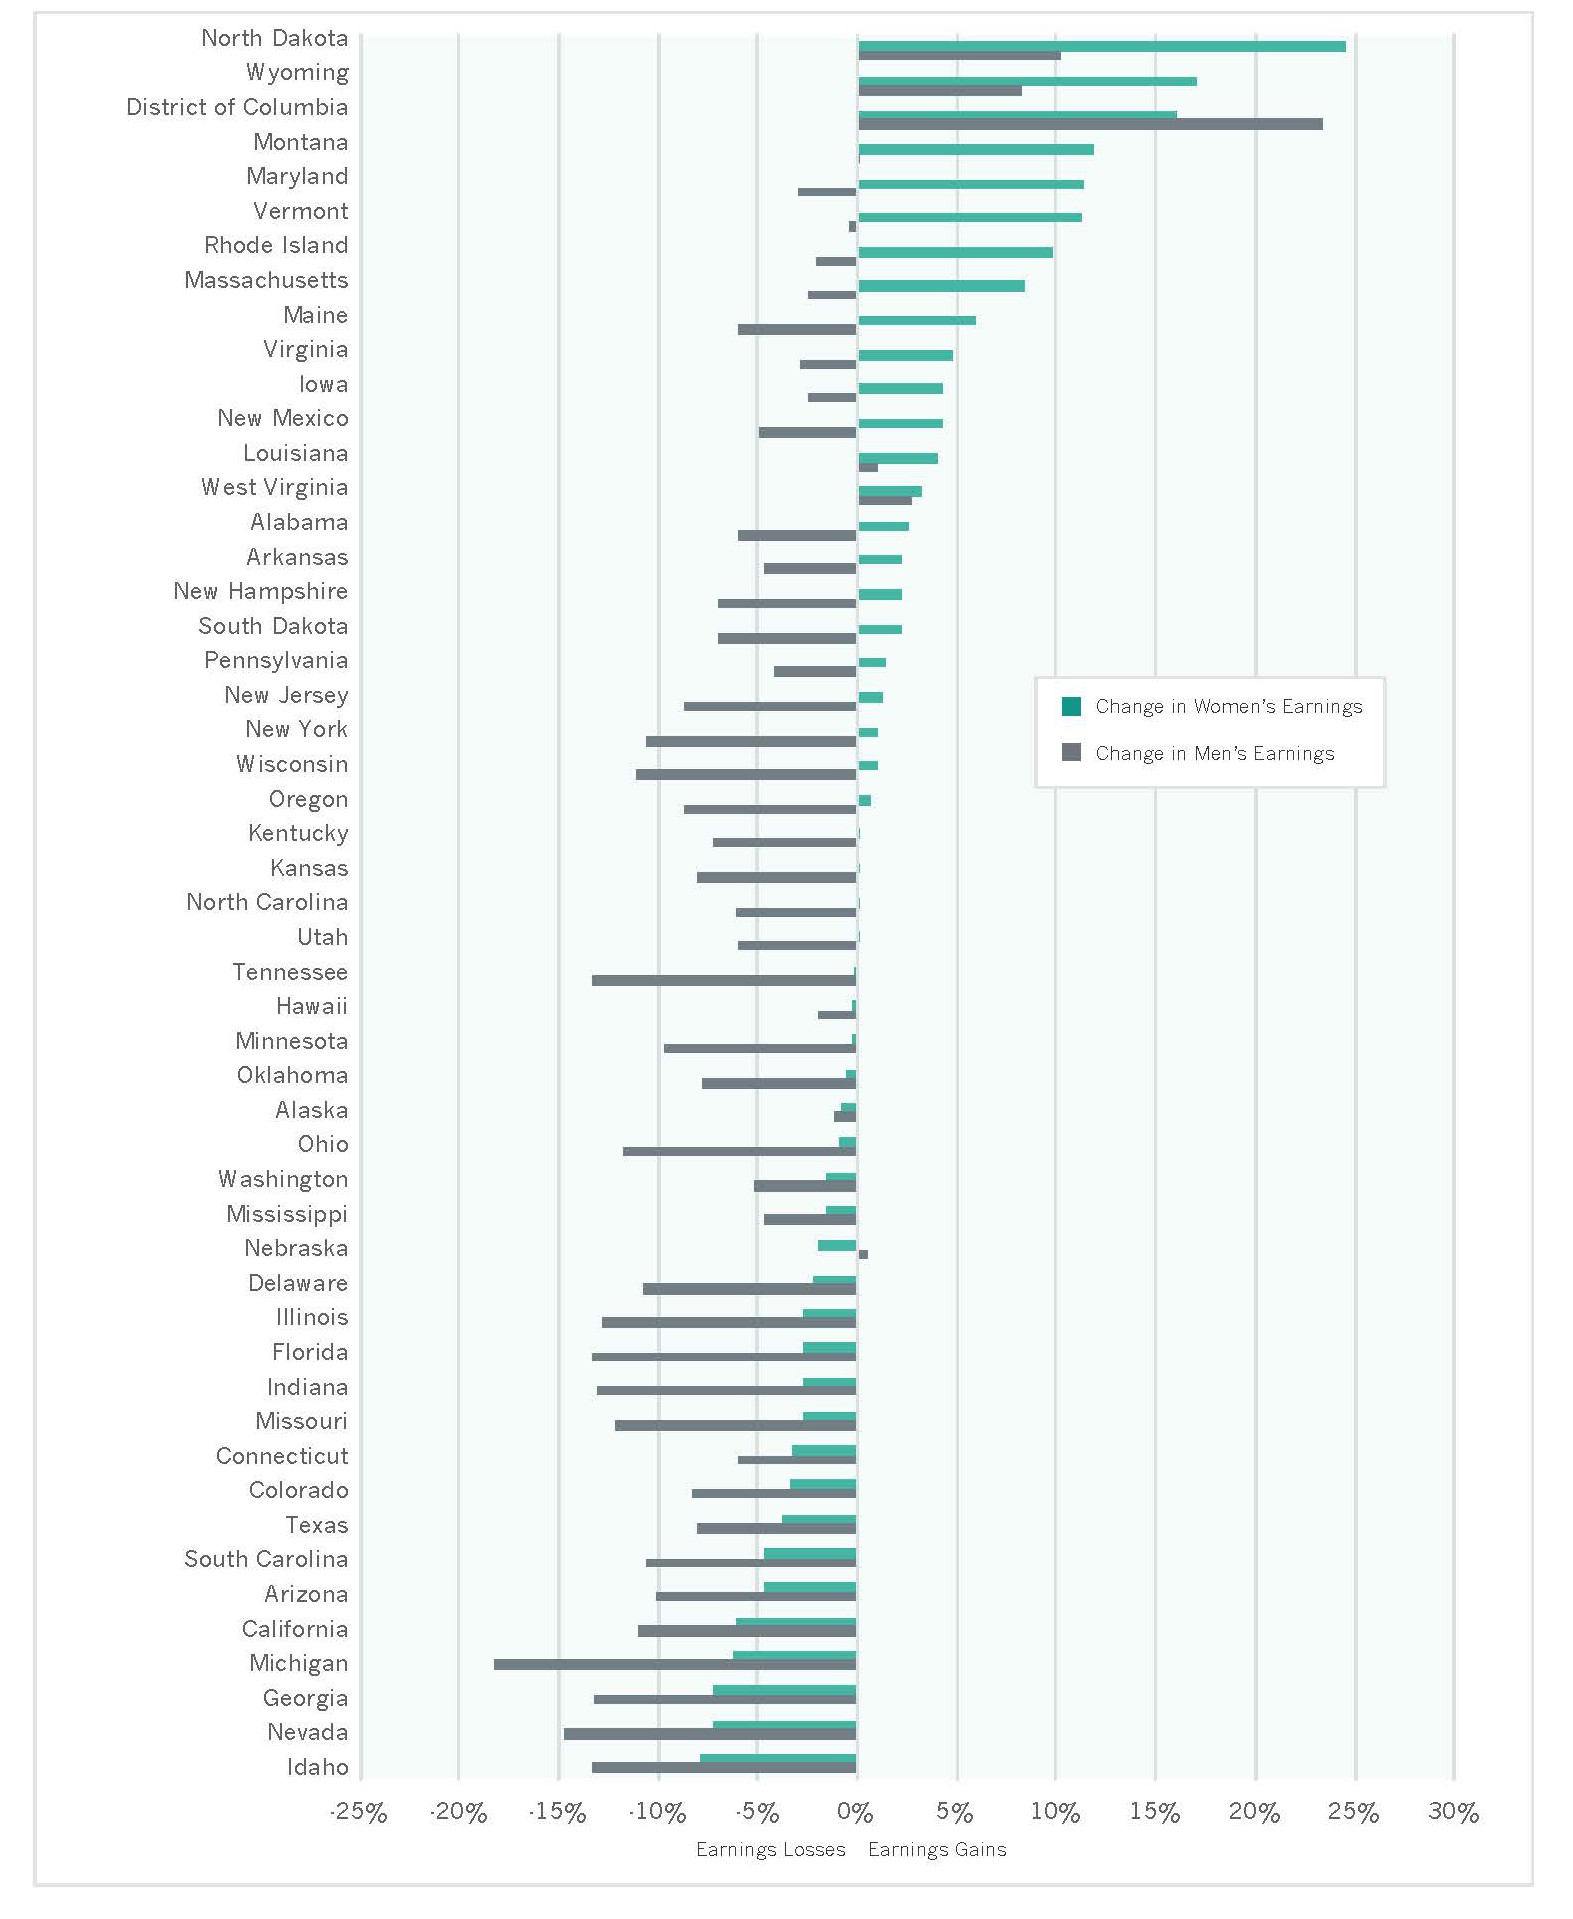 Source: IWPR analysis of 2000 Decennial Census (for calendar year 1999) and 2013 American Community Survey microdata (Integrated Public Use Microdata Series, Version 5.0).
The Gender Earnings Ratio
The change and stagnation in women’s and men’s real earnings over the last several decades have contributed to the narrowing of the gender wage gap in earlier decades and more recently stalled progress in further closing this gap. Between 1980 and 2000—when women’s real earnings grew while men’s remained unchanged—the gender earnings ratio increased from 60.2 percent (in 1980) to 71.6 percent (in 1990) to 73.7 percent (in 2000). Between 2001 and 2012—when both women’s and men’s earnings stagnated—the gender earnings ratio remained virtually constant (76.3 percent in 2001 and 76.5 percent in 2012; DeNavas-Walt and Proctor 2014).
The gender earnings ratio improved between 2012 and 2013 from 76.5 to 78.3 percent (DeNavas-Walt and Proctor 2014), yet in every state in the nation, women still earn less than men (Table 2.1). The gender earnings ratio varies considerably among states, from 87.6 percent in New York, the best state, to 66.7 percent in Louisiana, the worst state.
- In addition to New York, four other jurisdictions have a gender earnings ratio of 85 percent or higher (87.4 in Maryland, 87.0 in the District of Columbia, 86.4 in Vermont, and 85.0 in Florida).
- Women in Louisiana earn just 66.7 cents on the dollar compared with men, the worst earnings ratio in the nation. In two other states—West Virginia (67.3 percent) and Wyoming (67.9 percent)—the gender wage gap is also greater than 30 cents per dollar.
The Gender Wage Gap: Best and Worst States
| Best States | Worst States | ||||
Rank |
Gender Earnings Ratio |
Rank |
Gender Earnings Ratio |
||
New York |
1 |
87.60% |
Louisiana |
51 |
66.70% |
Maryland |
2 |
87.40% |
West Virginia |
50 |
67.30% |
District of Columbia |
3 |
87.00% |
Wyoming |
49 |
67.90% |
Vermont |
4 |
86.40% |
Utah |
48 |
70.00% |
Florida |
5 |
85.00% |
Nebraska |
47 |
73.10% |
If progress continues at the current rate since 1960, the disparity between women’s and men’s earnings in the United States overall will not close until the year 2058 (IWPR 2014a). Among the 50 states and the District of Columbia, Florida is projected to be the first state in the nation where women’s median annual earnings will reach parity with men’s, but not until the year 2038. In five states, women’s earnings are not expected to equal men’s until the next century. At the current rate of progress, the gender wage gap is expected to close last in Wyoming—in the year 2159 (Figure 2.2).
Figure 2.2. Projected Year for Closing the Gender Wage Gap by State
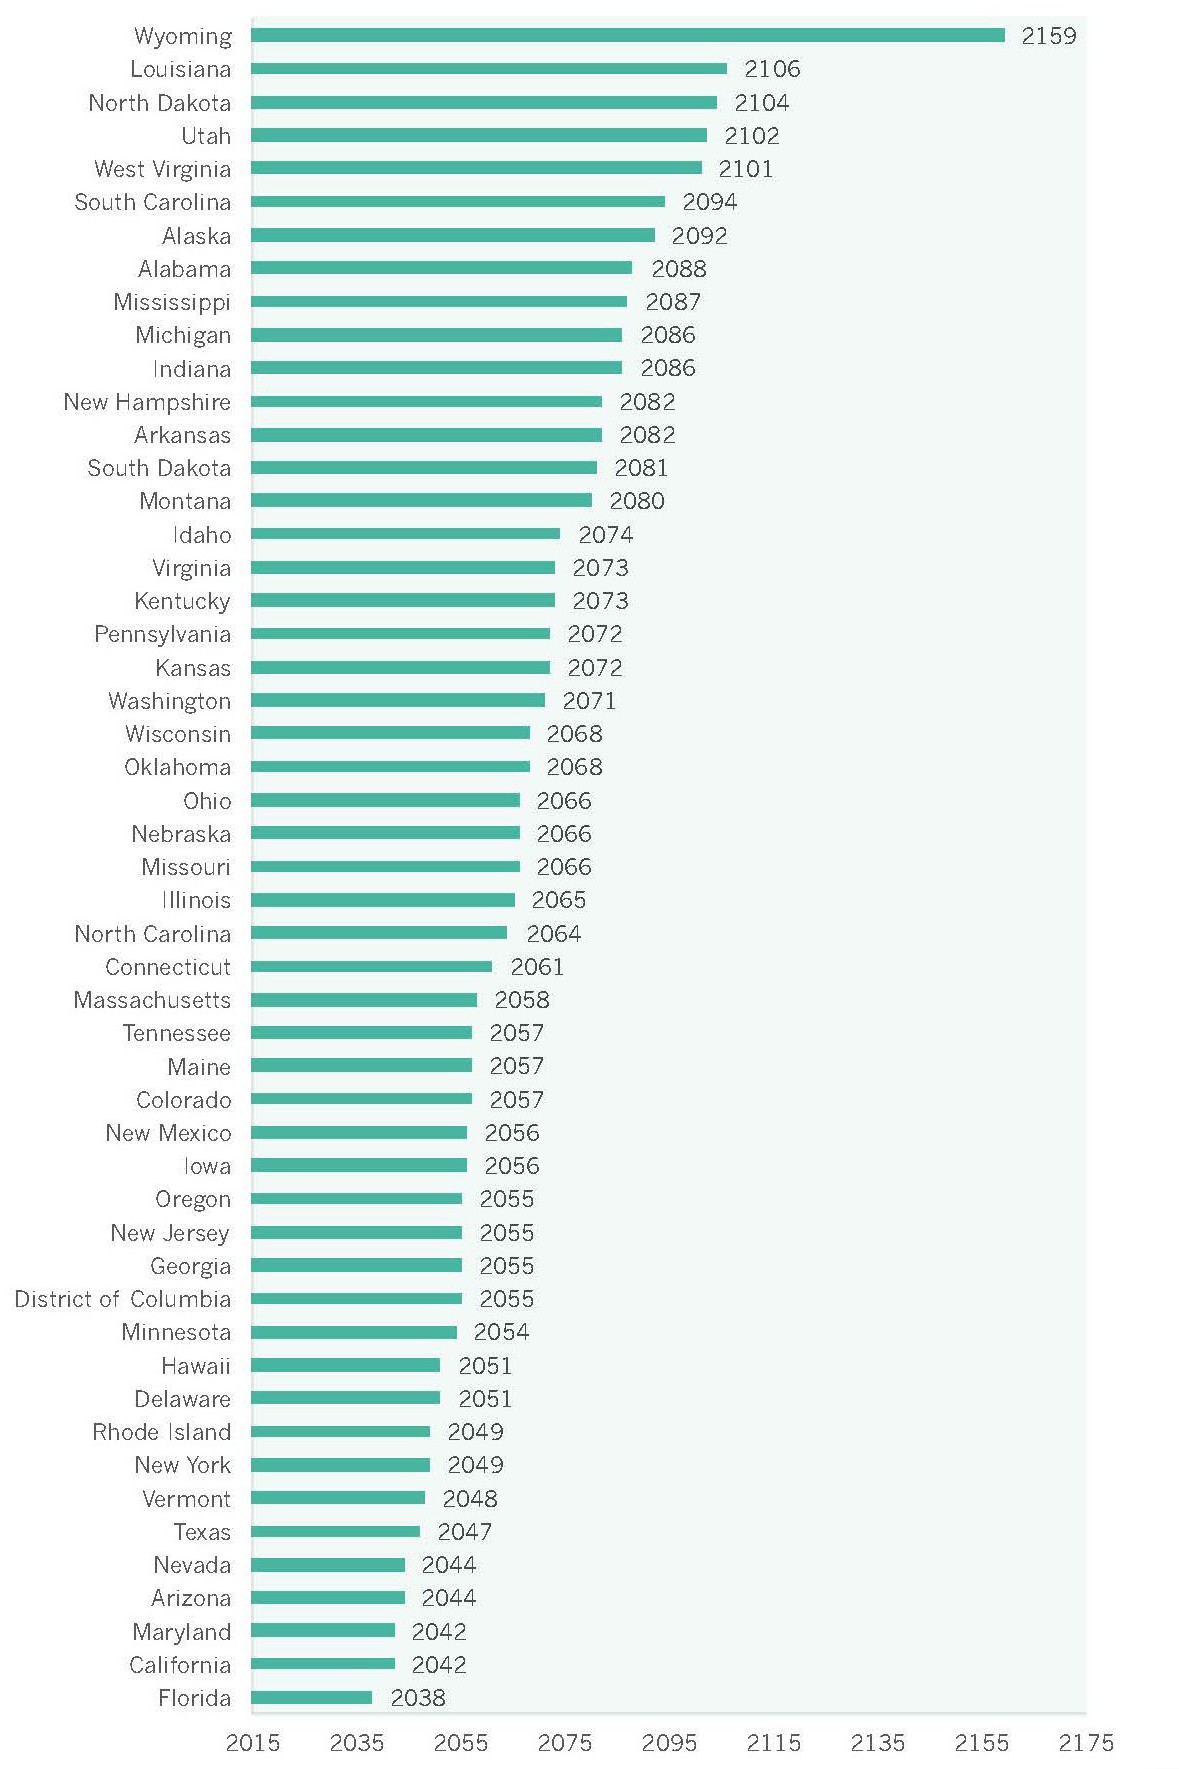
Note: Linear projection based on the current rate of progress in closing the gender wage gap since 1959. Projection is based on the ratio of women’s to men’s earnings among full-time, year-round workers aged 16 and older.
Source: IWPR calculations based on the 1960, 1970, 1980, and 2000 Decennial Censuses (for the calendar years 1959, 1969, 1979, 1989, and 1999) and the 2001–2013 American Community Surveys (Integrated Public Use Microdata Series, Version 5.0).
Earnings and the Gender Wage Gap for Women of Color
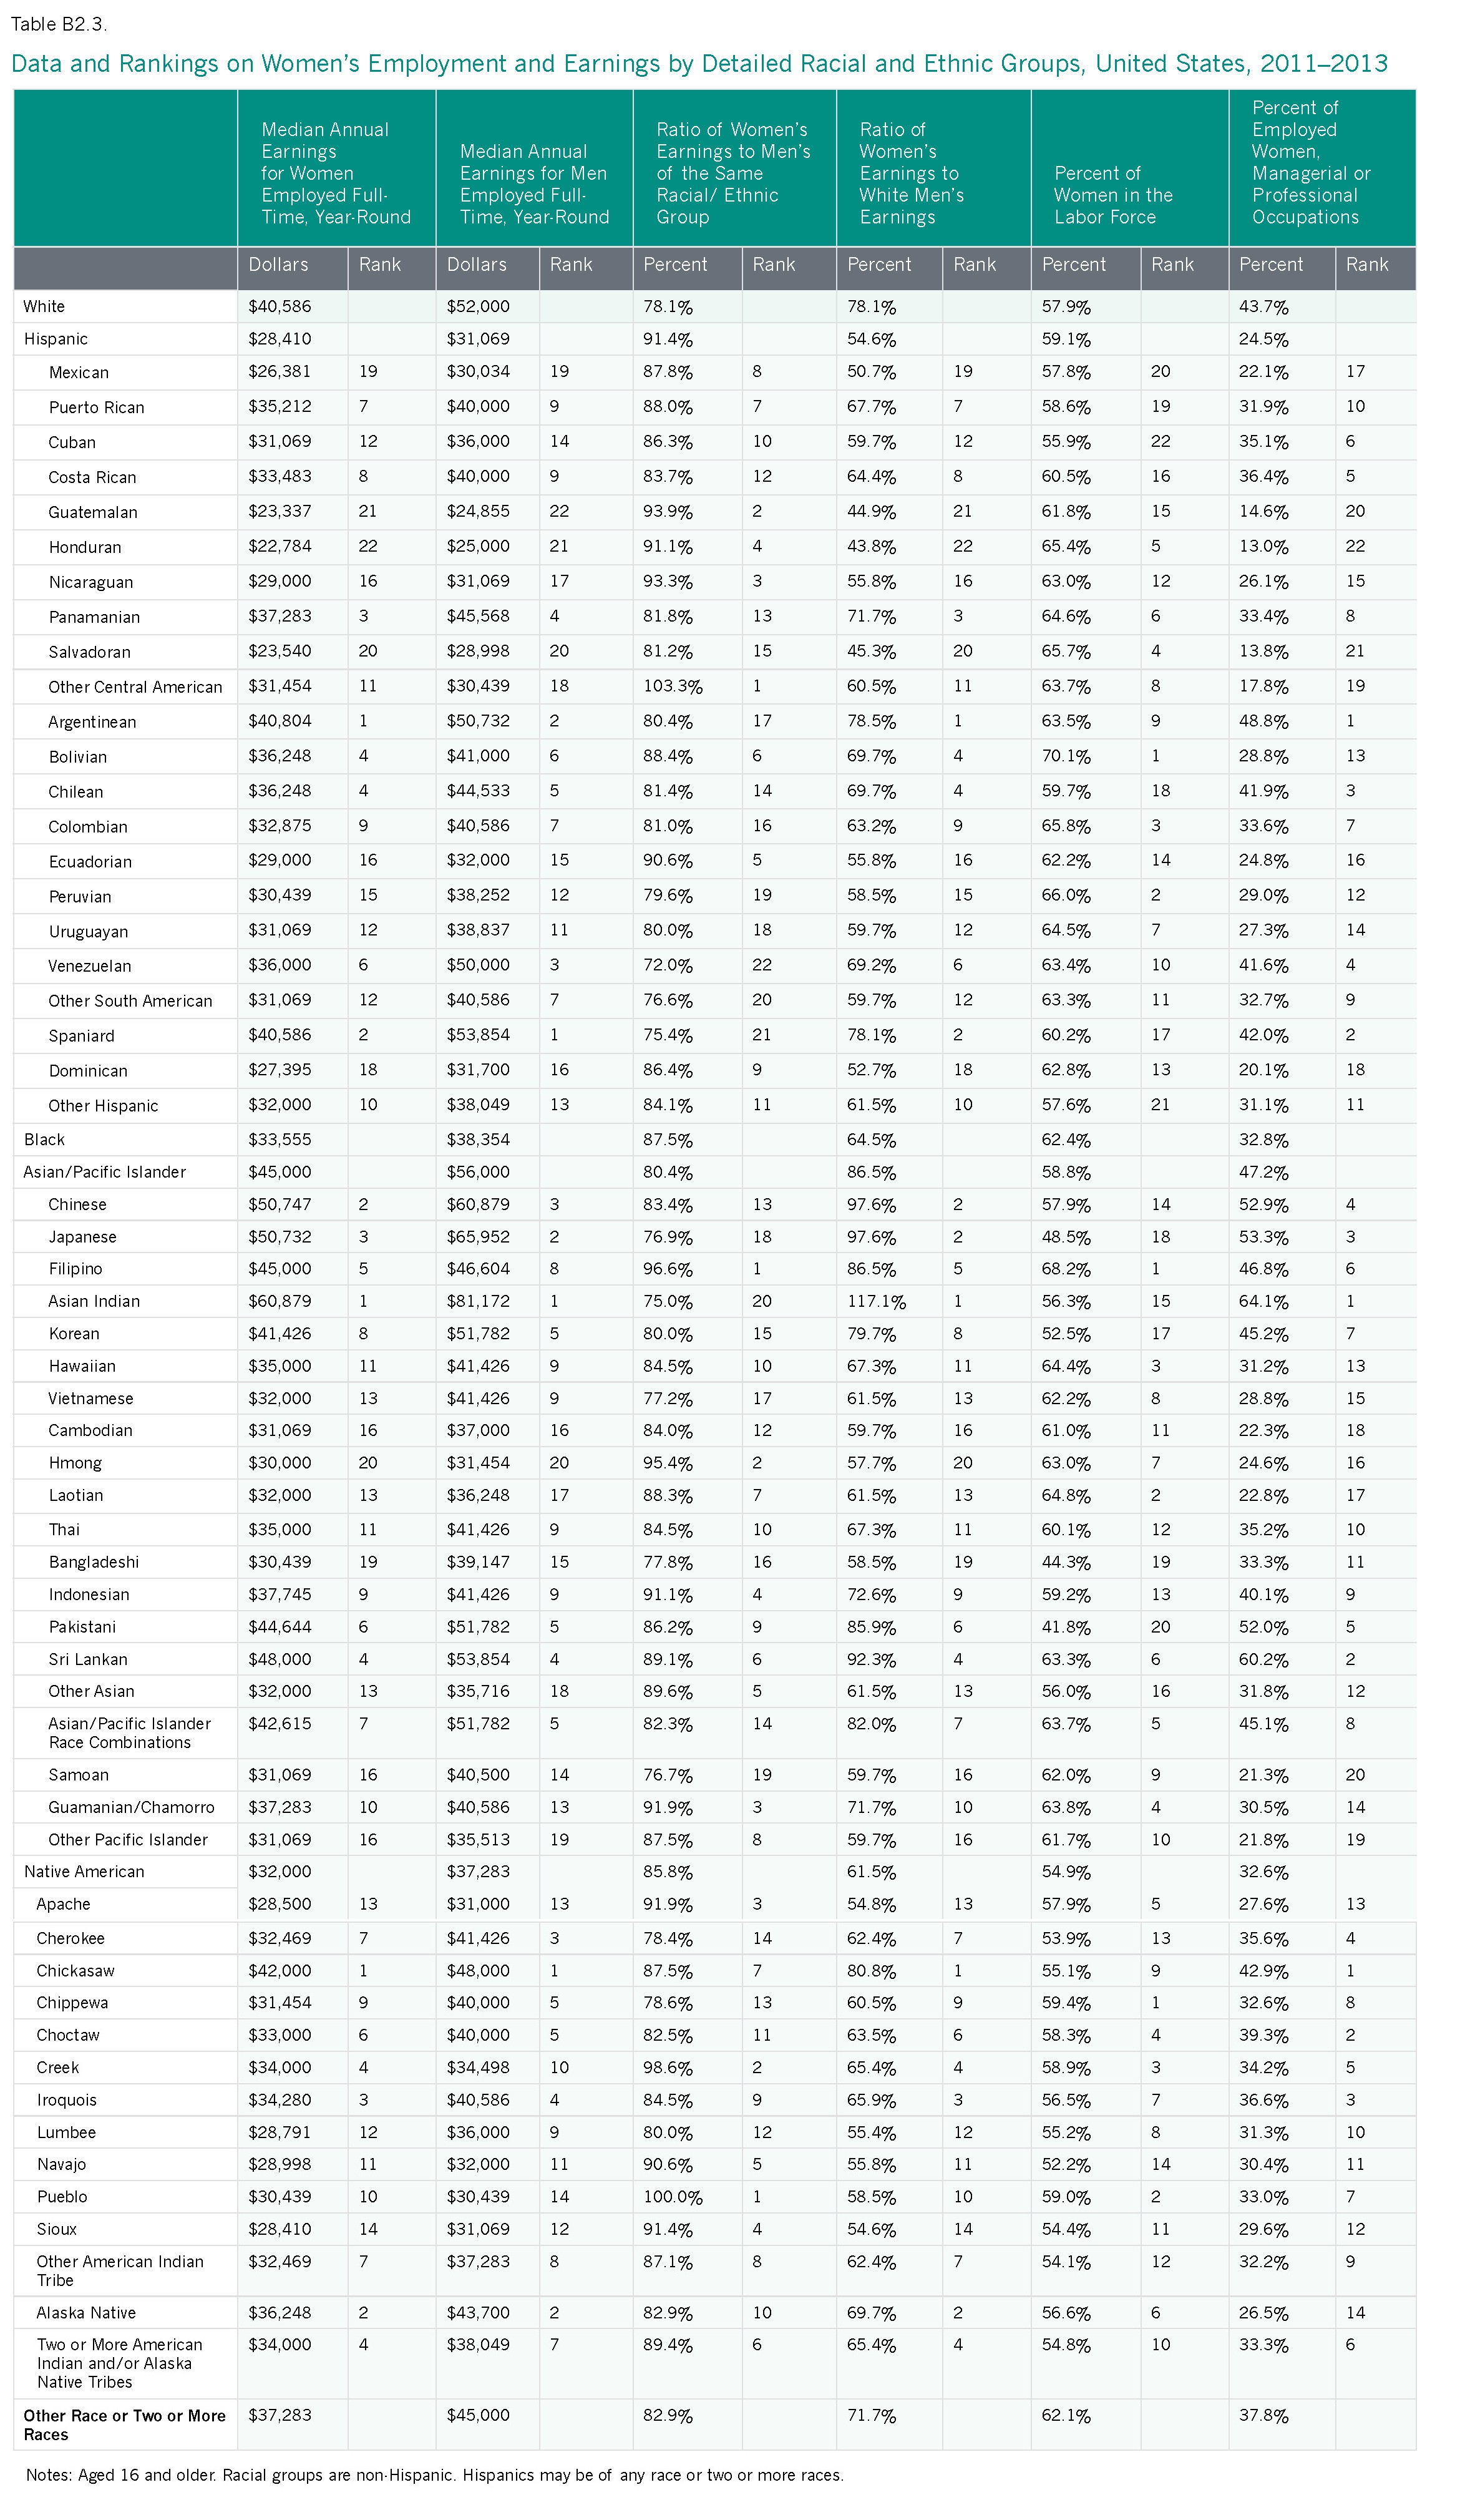
Women’s earnings differ considerably by race and ethnicity. Across the largest racial and ethnic groups in the United States, Asian/Pacific Islander women have the highest median annual earnings at $46,000, followed by white women ($40,000). Native American and Hispanic women have the lowest earnings at $31,000 and $28,000, respectively (Figure 2.3; Appendix Table B2.3).
Figure 2.3. Median Annual Earnings for Women and Men Employed Full-Time, Year-Round by Race/Ethnicity, United States, 2013
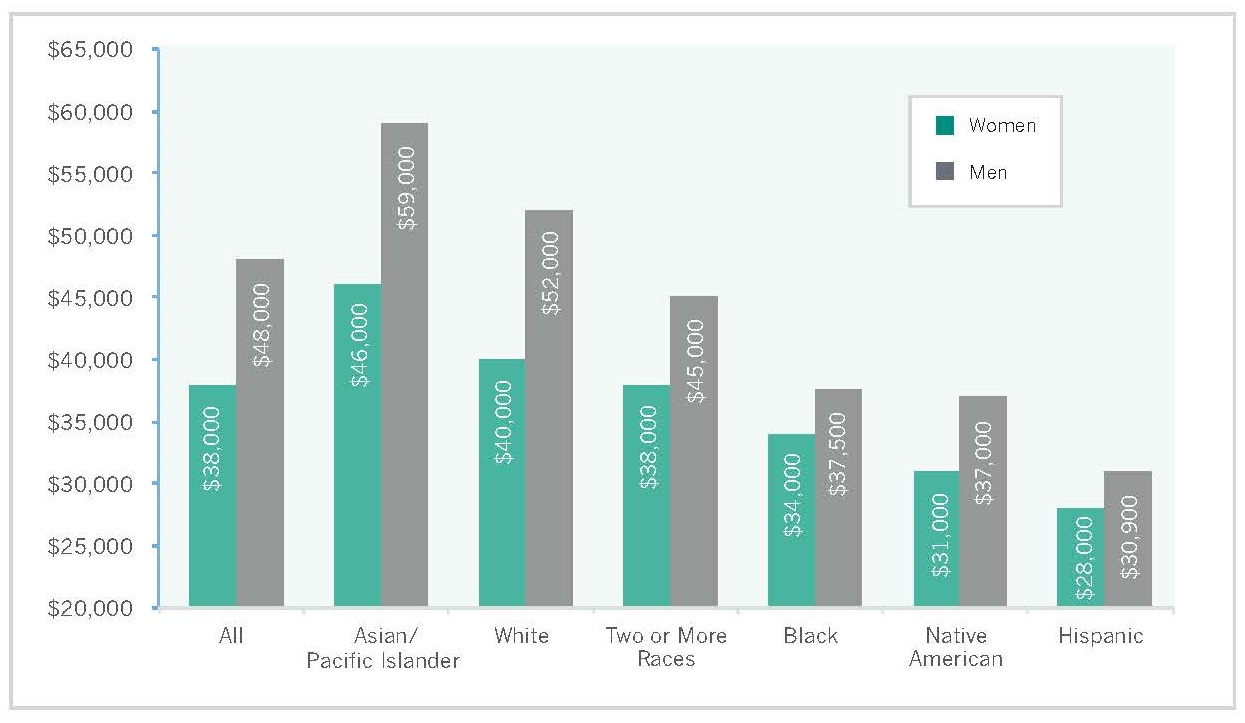 Notes: For women and men aged 16 and older. Racial groups are non-Hispanic. Hispanics may be of any race or two or more races.
Source: IWPR analysis of American Community Survey microdata (Integrated Public Use Microdata Series, Version 5.0).
While Asian/Pacific Islander women overall have the highest earnings and Hispanic and Native American women have the lowest earnings, significant differences exist within these groups. Among Asian/Pacific Islander women, Indian women have the highest median annual earnings at $60,879—more than twice the earnings of the lowest earning group, the Hmong ($30,000), and approximately twice the earnings of the second lowest group, the Bangladeshi ($30,439). Among Hispanic women, women of Argentinian and Spanish descent have the highest earnings at $40,804 and $40,586, respectively, while women of Honduran and Guatemalan descent have the lowest earnings at $22,784 and $23,337. Among Native American women, median annual earnings are highest among the Chickasaw ($42,000), and lowest among the Sioux ($28,410) and Apache ($28,500; Table B2.3). These earnings differences likely stem, in part, from differences in education levels; women from the higher-earning racial and ethnic groups are more likely to hold a college degree (IWPR 2015).
In all the racial and ethnic groups shown in Figure 2.3 and all but two of the detailed groups shown in Table B2.3—the Pueblo and “other” Central Americans—women earn less than men. Among the groups in Figure 2.3, the differences are smallest for blacks and Hispanics, due to the comparatively low earnings of black and Hispanic men, which are considerably less than the earnings of men overall.
Another way of examining gender earnings differences is to compare earnings for different groups of women with the largest group in the labor force, white men. Hispanic women face the largest earnings gap, with median annual earnings that are slightly more than half those of white men (53.8 percent). Asian/Pacific Islander women face the smallest gap, but still earn only 88.5 percent of white men’s earnings (Table 2.2).
See More on the Employment and Earnings of:
Table 2.2. Women’s and Men’s Median Annual Earnings and the Gender Earnings Ratio, Full-Time, Year-Round Workers, United States, 2013
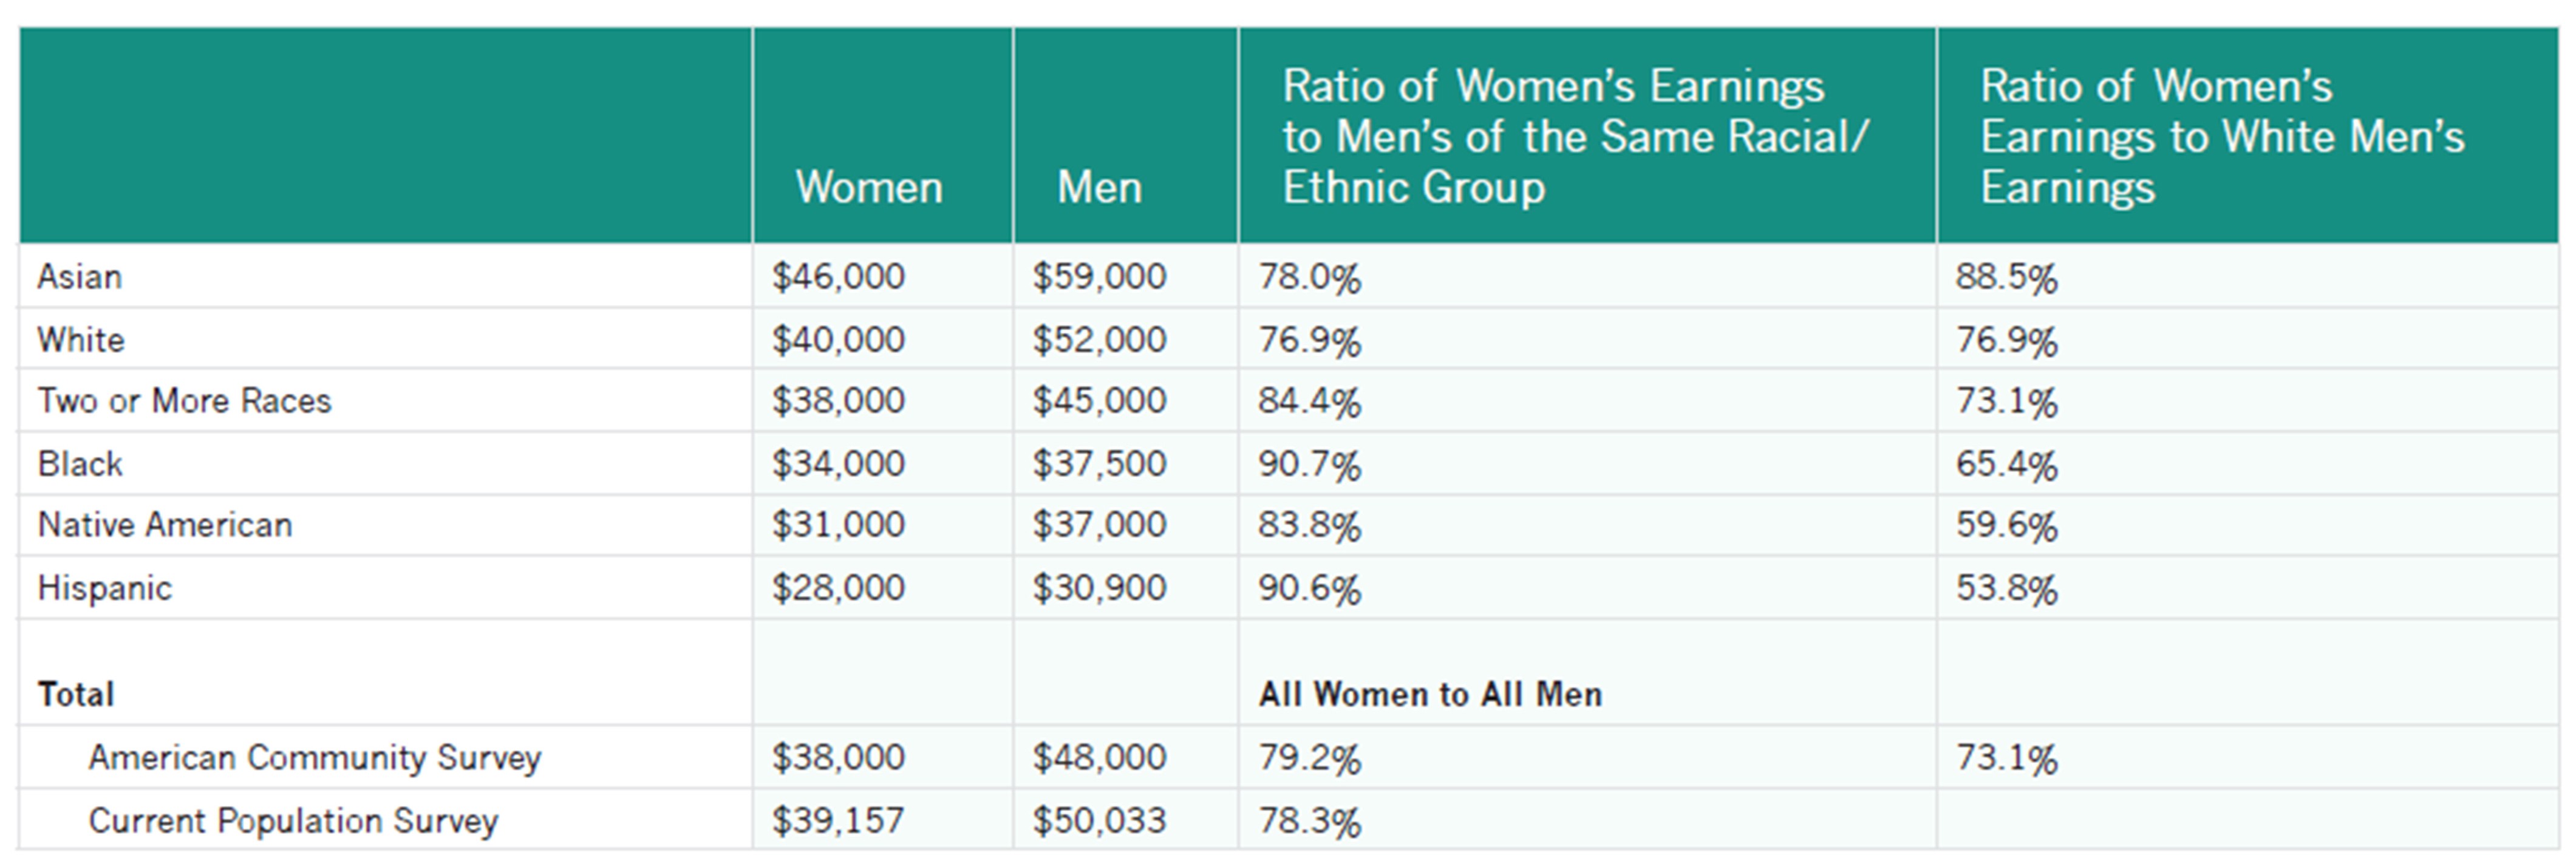 Notes: For women and men aged 16 and older. Racial groups are non-Hispanic. Hispanics may be of any race or two or more races.
Source: IWPR analysis of American Community Survey microdata (Integrated Public Use Microdata Series, Version 5.0).
The Earnings Ratio by Educational Attainment
Education increases women’s earnings but does not eliminate the gender wage gap. In the United States, women with a bachelor’s degree earn, on average, more than twice the amount that women with less than a high school diploma earn (Figure 2.4). Yet, women who work full-time, year-round earn less than men at the same educational level, and at all but one level they earn the same as or less than men with lower educational qualifications. The gap in earnings is largest for those with the highest levels of educational attainment: women with a graduate degree earn only 69.1 percent of what comparable men earn, and women with a bachelor’s degree earn 71.4 percent of the amount their male counterparts earn. These data indicate that women need more educational qualifications than men do to secure jobs that pay well.
Figure 2.4. Median Annual Earnings and the Gender Earnings Ratio for Women and Men at Different Educational Levels, 2013
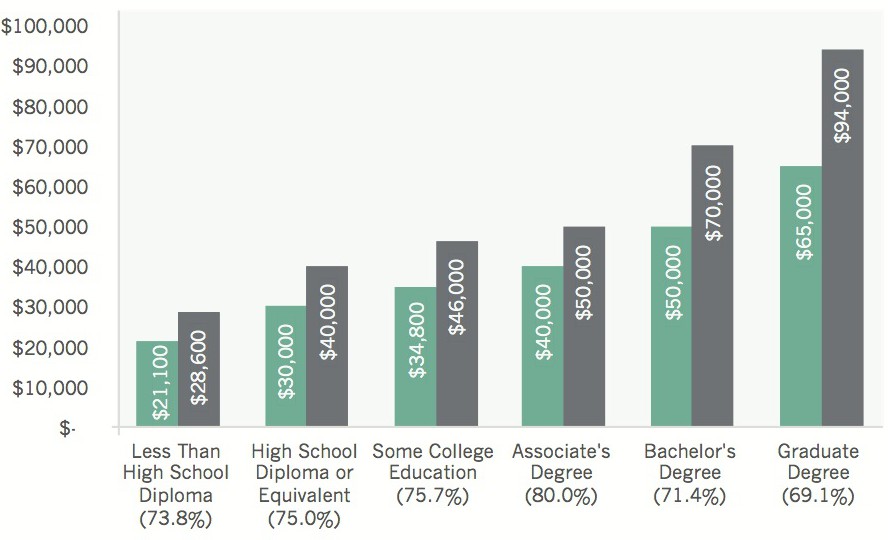
Notes: Full-time, year-round workers aged 25 years and older. Percentages in parentheses show women’s earnings as percent of men’s earnings.
Source: IWPR analysis of American Community Survey microdata (Integrated Public Use Microdata Series, Version 5.0).
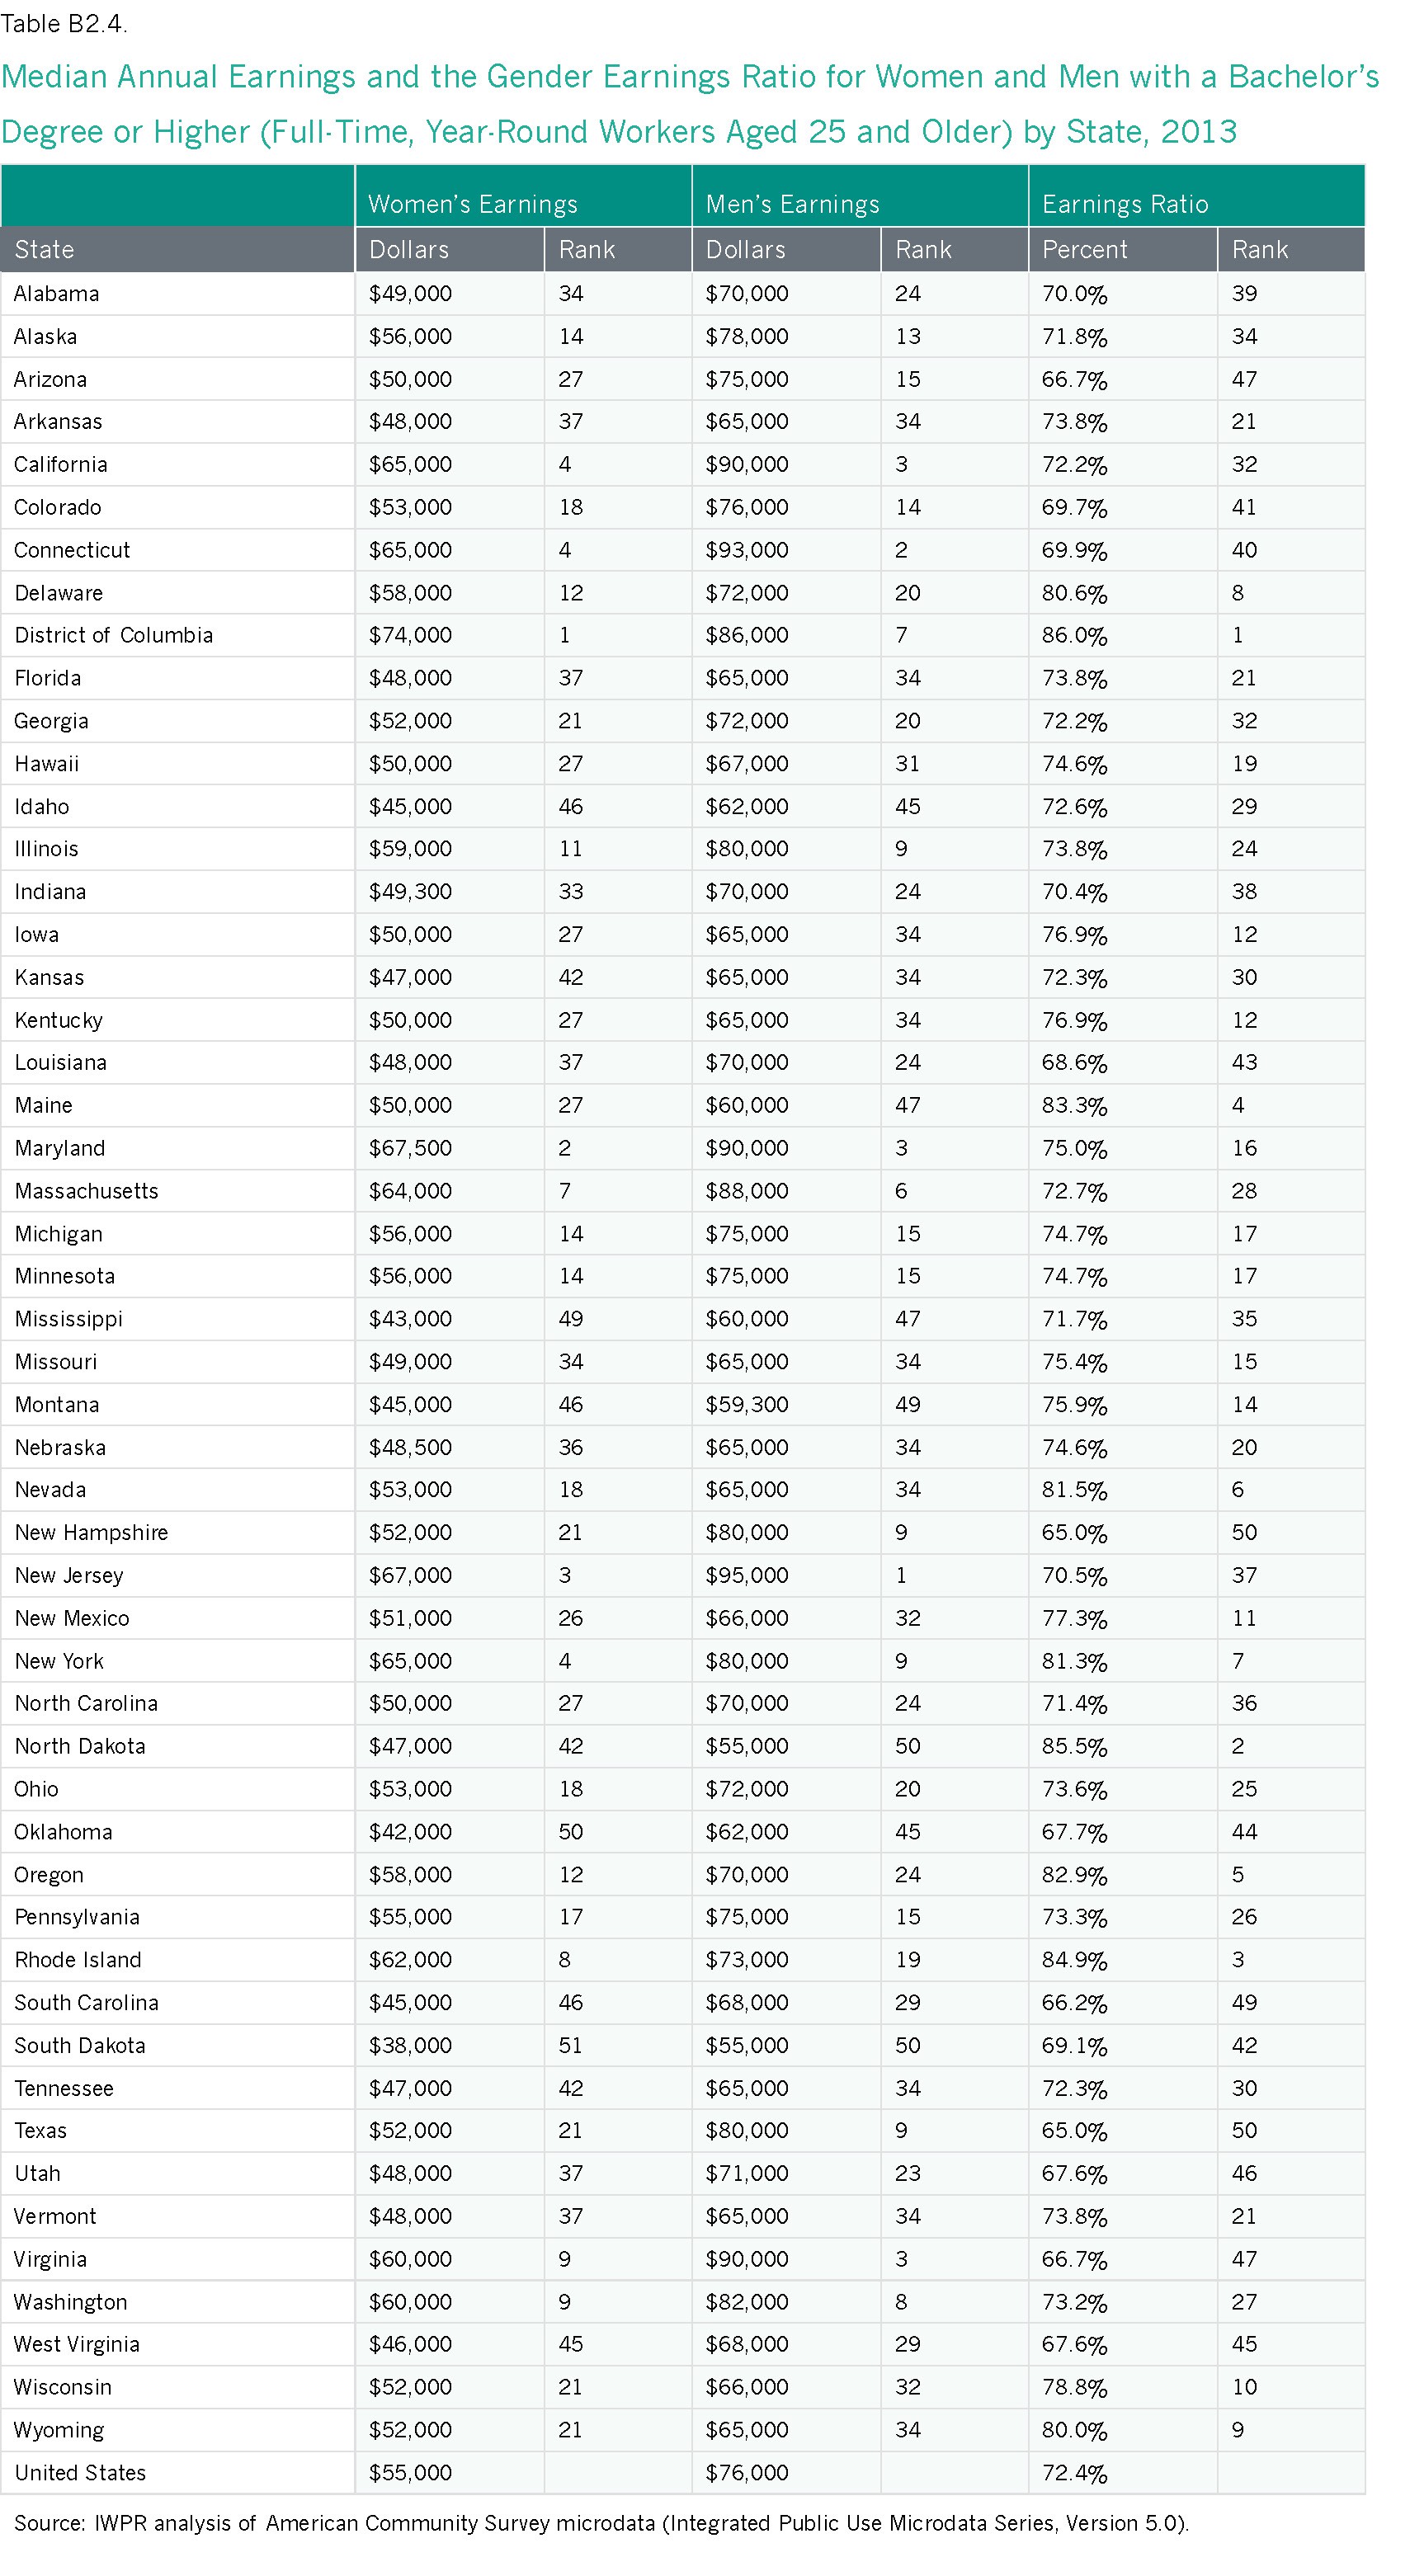
- Median annual earnings for women with at least a bachelor’s degree are highest in the District of Columbia ($74,000). Five other states—California, Connecticut, Maryland, New Jersey, and New York—have median annual earnings for women with a bachelor’s degree or higher of at least $65,000 per year (Table B2.4).
- Median annual earnings for women with a bachelor’s degree or higher are lowest in South Dakota ($38,000). Oklahoma has the second lowest earnings for women with at least a bachelor’s degree at $42,000, followed by Mississippi ($43,000; Table B2.4).
- The District of Columbia has the highest gender earnings ratio for workers with at least a bachelor’s degree (86.0 percent), followed by North Dakota (85.5 percent) and Rhode Island (84.9 percent; Table B2.4). The gender earnings ratio for workers with at least a bachelor’s degree is lowest in New Hampshire and Texas (both at 65.0 percent). In three other states, the ratio is also below 67 percent (South Carolina at 66.2 percent, and Arizona and Virginia at 66.7 percent; Table B2.4).
State Statutes That Address the Gender Wage Gap
- Tackling Pay Secrecy: As of 2014, ten states had enacted laws that prohibit employer retaliation against employees who inquire about other employees’ wages or disclose their own: California, Colorado, Illinois, Louisiana, Maine, Michigan, Minnesota, New Hampshire, New Jersey, and Vermont (U.S. Department of Labor 2014).
- Tackling the Undervaluation of Women’s Work: As of January 2015, the District of Columbia and at least five states—Iowa, Minnesota, Montana, Washington, and West Virginia—have “comparable worth” statutes or regulations for public employees to address the undervaluation of work performed mainly by women. These statutes and regulations require that compensation for work of comparable worth—measured by the skill, effort, responsibility, and working conditions—be equitable (IWPR n.d.).
- Tackling Low Wages: As of January 1, 2015, 29 states and the District of Columbia had a minimum wage that was higher than the federal minimum wage of $7.25. The minimum wage was highest in the District of Columbia at $9.50 per hour; seven states had a minimum wage of at least $9.00 per hour (U.S. Department of Labor 2015a). Several other states are scheduled to increase above $9.50 in future years.
- Tackling the Low Tipped Minimum Wage: As of 2014, seven states required employers to pay tipped workers the full state minimum wage: Alaska, California, Minnesota, Montana, Nevada, Oregon, and Washington (U.S. Department of Labor 2015b). An additional 26 states and the District of Columbia required employers to pay tipped workers above the federal tipped minimum wage of $2.13 an hour, ranging from a state tipped minimum wage of $2.23 in Delaware to a state tipped minimum wage in Connecticut of $5.78 (for the hotel and restaurant industry) and $7.46 (for bartenders who customarily receive tips; U.S. Department of Labor 2015b).
Cumulative Losses from the Gender Wage Gap
Losses from the gender wage gap accumulate over the course of a woman’s lifetime. Average lifetime losses for all women who were born between 1955 and 1959 and worked full-time, year-round each year total $531,502 by age 59 (Figure 2.5). Among college-educated women, the losses were even greater, due in part to the larger gender wage gap that women with this level of education face (see Figure 2.4). Women with a college education who were born between 1955 and 1959 and worked full-time, year-round each year lost, on average, nearly $800,000 by age 59 due to the gender wage gap (Figure 2.5).
Figure 2.5. Cumulative Losses from the Gender Wage Gap for All Women and College-Educated Women Born in 1955–1959, United States
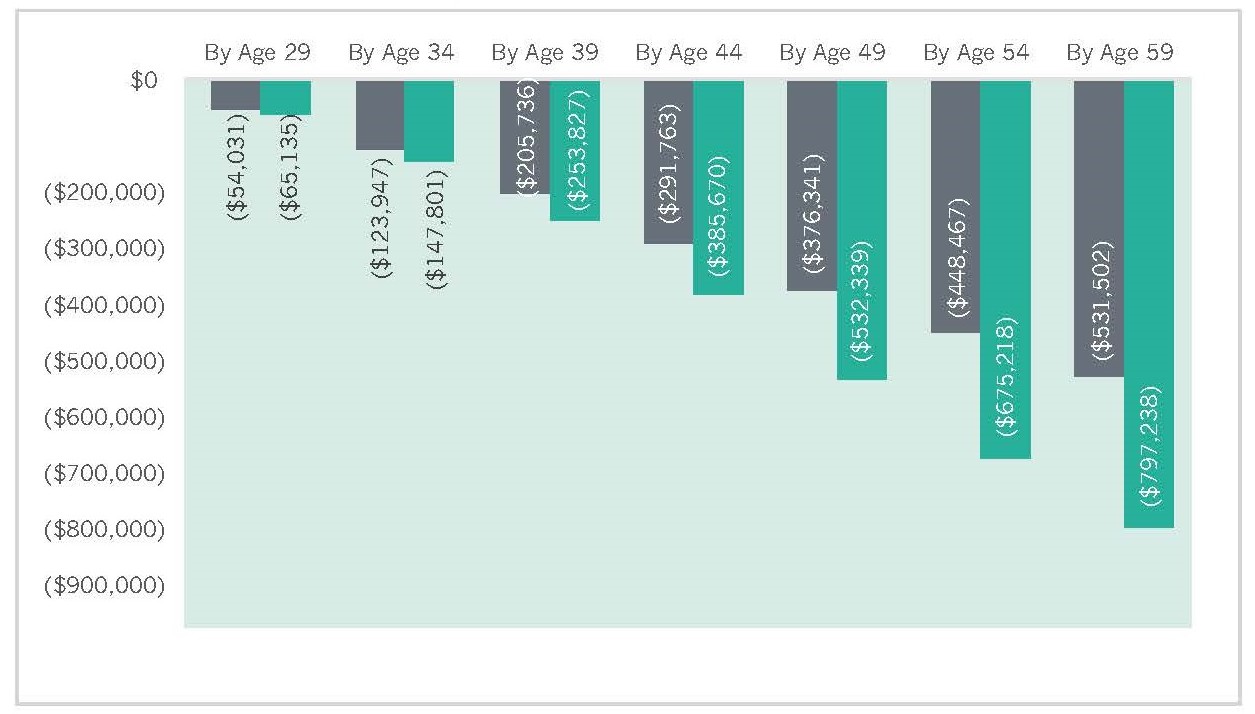
Note: Data reflect the difference between the median annual earnings of women and men who worked full-time, year-round each year.
Source: IWPR analysis of data from the Current Population Survey Annual Social and Economic Supplement (Integrated Public Use Microdata Series, Version 3.0).
Gender Inequality in Low and High Paid Jobs
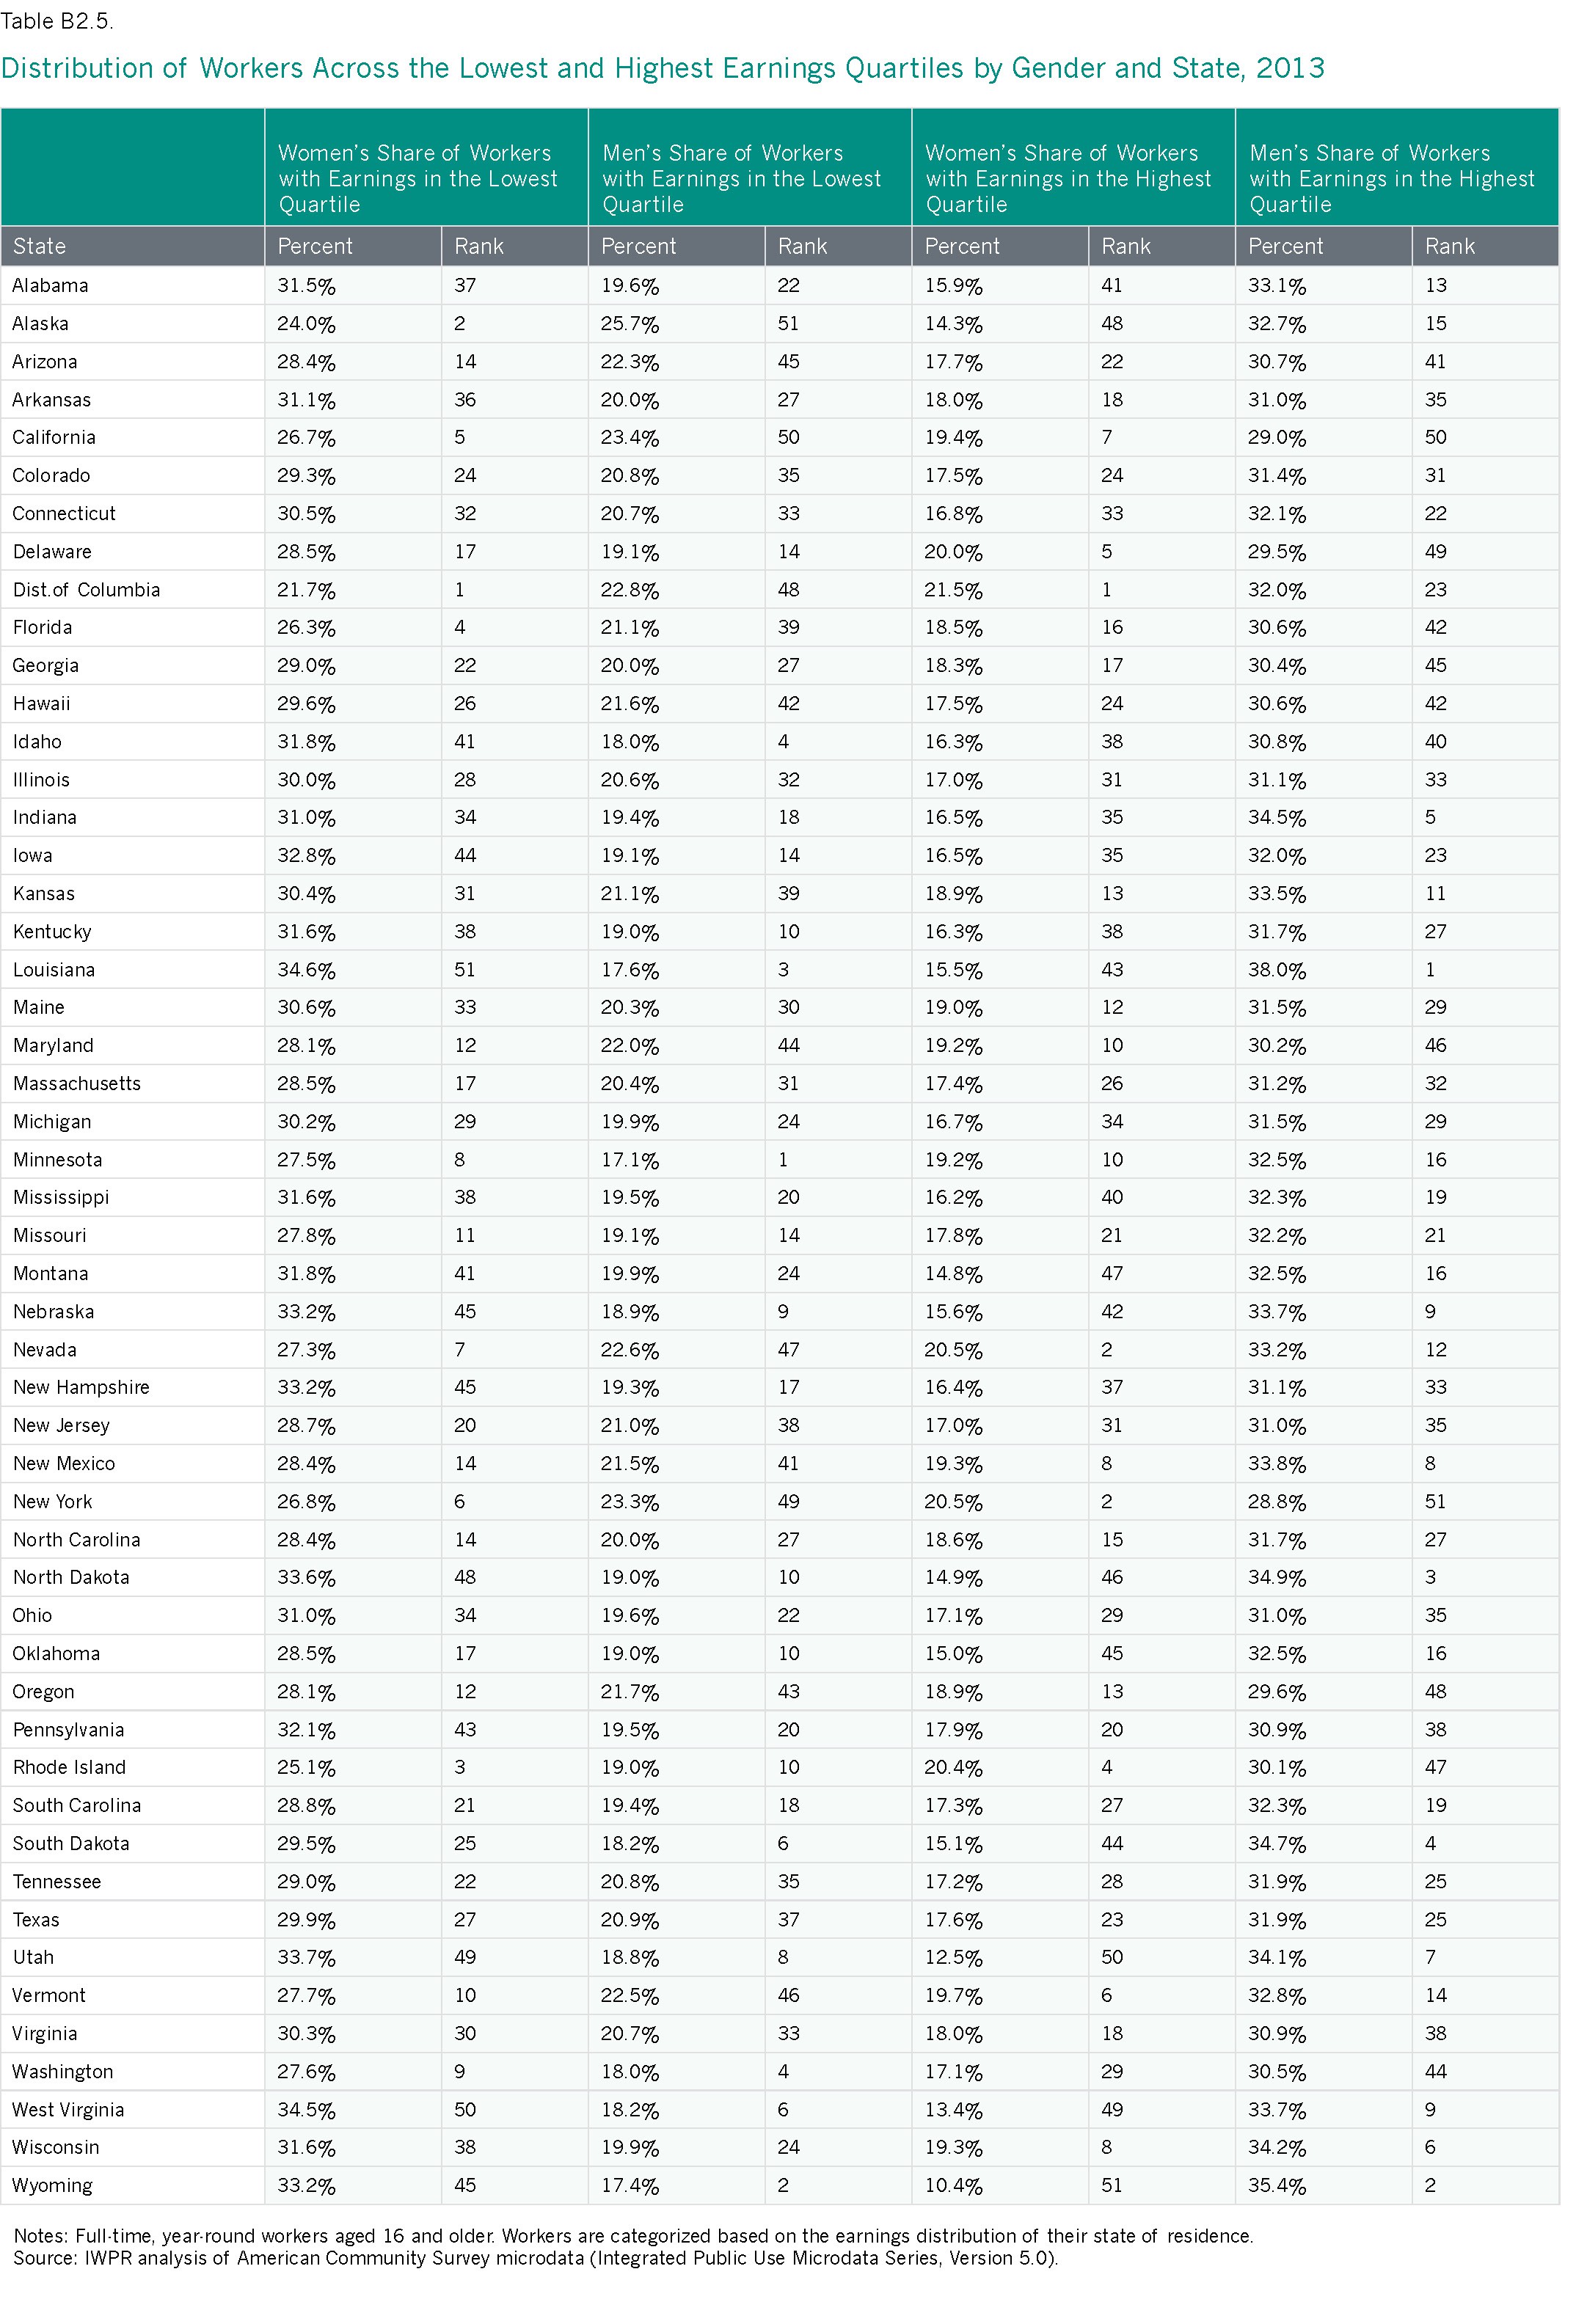
Median earnings capture the midpoint in the earnings distribution: half of all workers earn above and half earn below the median. Another way of comparing earnings is to examine the gender composition of those among the highest and lowest earnings quartiles in a state. In 2013, women were less likely than men to be among the highest earners in all states in the nation (Table B2.5).
- The District of Columbia has the highest proportion of women among the top quartile of earners at 21.5 percent. New York and Nevada tie for second with 20.5 percent each, followed by Rhode Island (20.4 percent). Women are least likely to be in the highest-earning quartile in Wyoming (10.4 percent), Utah (12.5 percent), and West Virginia (13.4 percent).
- The states with the largest proportions of women in the lowest earnings quartile are Louisiana (34.6 percent), West Virginia (34.5 percent), and Utah (33.7 percent). Women are least likely to have earnings in the lowest quartile in the District of Columbia (21.7 percent), Alaska (24.0 percent), and Rhode Island (25.1 percent).
The Union Advantage for Women
Union representation brings wage setting into the open and helps ensure that employers set wages based on objective criteria, such as skill, effort, and responsibility. Unions tend to raise wages for all represented workers, especially those, research shows, who are at the middle and bottom of the wage distribution, who are disproportionately women (Jones, Schmitt, and Woo 2014).
- Among full-time workers aged 16 and older, women represented by unions earn an average of $212, or 30.9 percent, more per week than women in nonunion jobs.6 Men of the same age range who are represented by unions earn, on average, $173 more per week (or 20.6 percent) than those without union representation (Table 2.3).
- Women who are represented by unions earn 88.7 cents on the dollar compared with their male counterparts, a considerably higher earnings ratio than the earnings ratio between all women and men in the United States.
- Among the racial and ethnic groups shown in Table 2.3, the difference in earnings between those with and without union representation is largest for Hispanics. Hispanic women represented by unions have median weekly earnings that are 42.1 percent higher than those without union representation. Hispanic men with union representation have earnings that are 40.6 percent higher than their nonunion counterparts.
Table 2.3 Union Wage Advantage by Gender and Race/Ethnicity, United States, 2014 Median Weekly Earnings for Full-Time Wage and Salary Workers
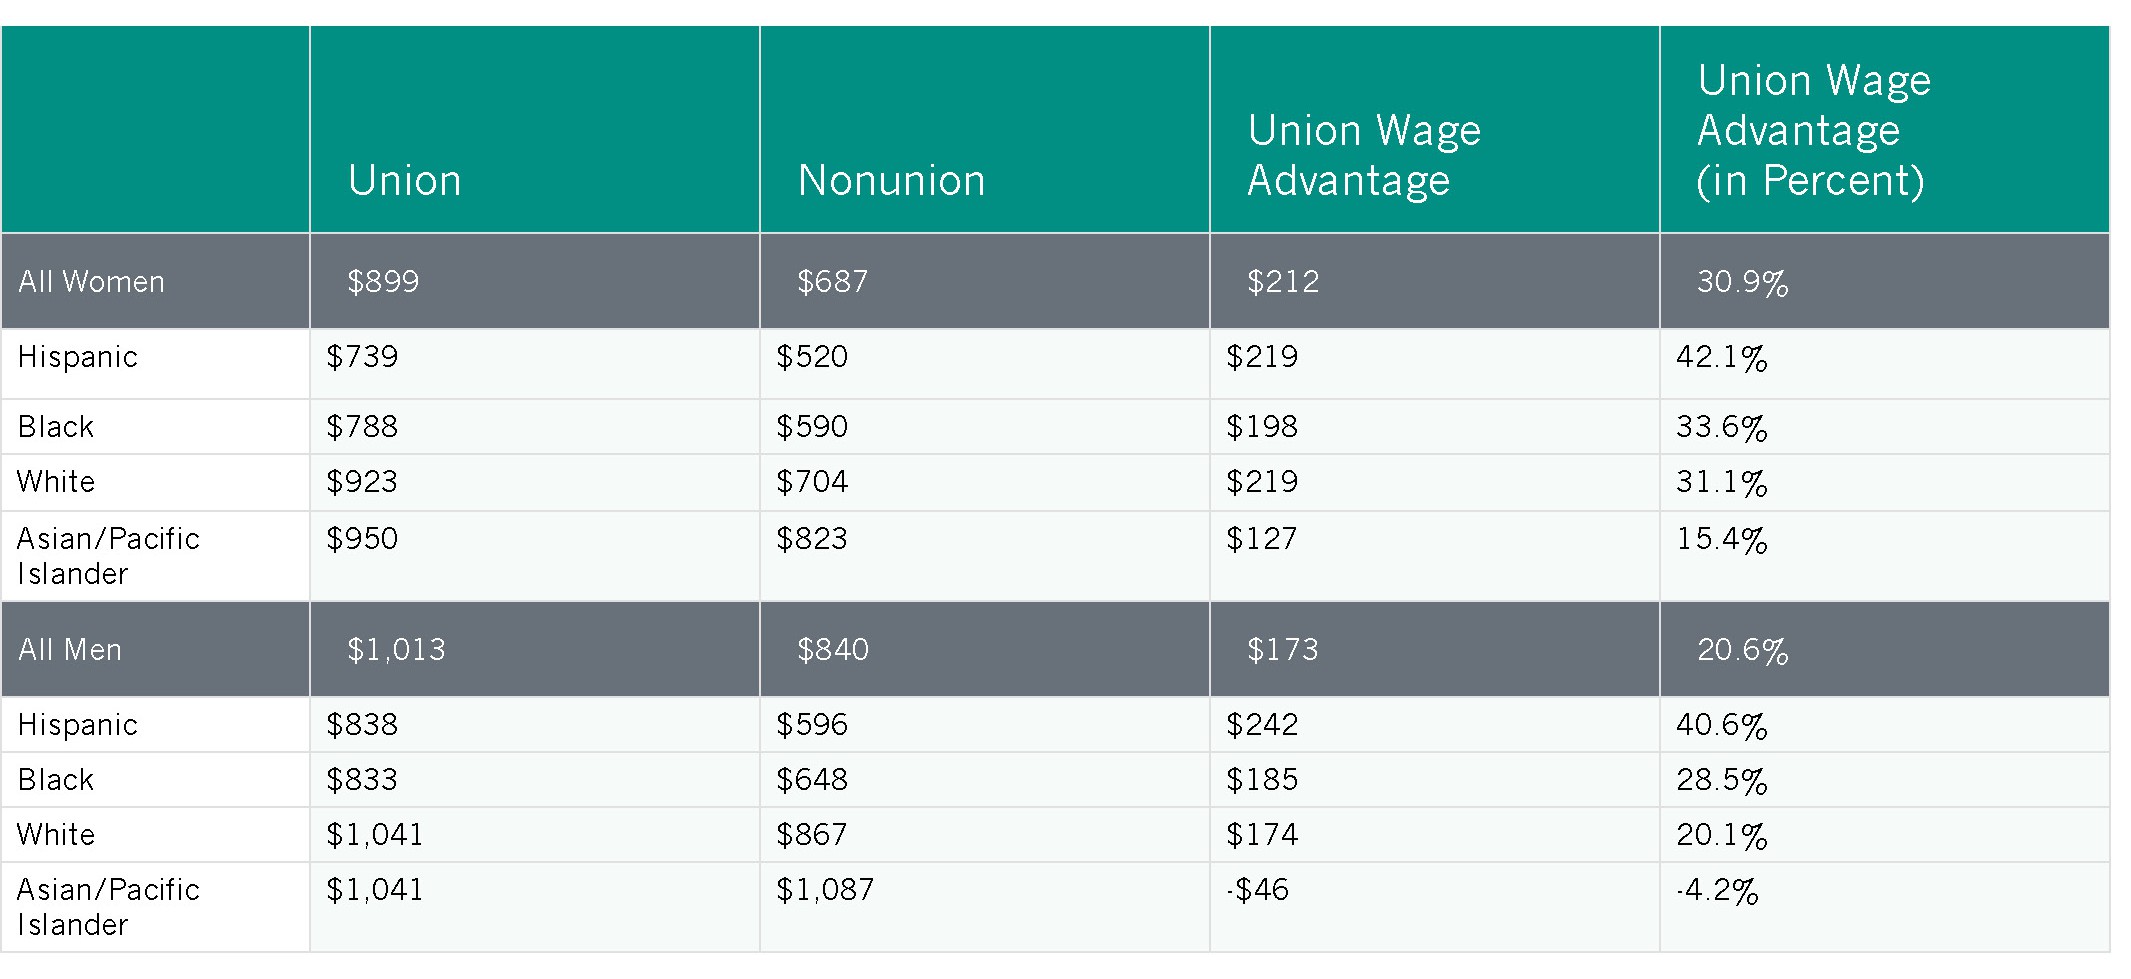
Note: Hispanics may be of any race or two or more races and are classified by both ethnicity and race. Data are not available for Native Americans or those who identify with two or more races. Self-employed workers are excluded.
Source: IWPR compilation of data from the U.S. Bureau of Labor Statistics (2015b).
Women’s Labor Force Participation
Women’s increased labor force participation represents a significant change in the U.S. economy since 1950. As of 2014, nearly six in ten women aged 16 and older (57.0 percent) worked outside the home (U.S. Bureau of Labor Statistics 2015a), compared with 33.9 percent in 1950 and 43.3 percent in 1970 (Fullerton 1999). Women now comprise nearly half of the U.S. labor force at 46.8 percent (U.S. Bureau of Labor Statistics 2015a). In each state, however, women are still less likely to be in the workforce than men (Table B2.1).
- Among all states, Alaska has the highest rate of women’s labor force participation; 68.3 percent of women aged 16 and older work. Women in the Midwest have the strongest labor force participation rates overall: Minnesota, Nebraska, North Dakota, South Dakota, and Wisconsin all rank in the top ten. Other top ten jurisdictions include the District of Columbia, Maryland, Massachusetts, and Wyoming (Table 2.1).
- Fewer than half of women (49.3 percent) are in the labor force in West Virginia, the state with the lowest labor force participation rate of women in the nation. Southern states overall also have very low rates; Alabama, Arkansas, Florida, Kentucky, Louisiana, and Mississippi also rank in the bottom ten. Two Mountain West states—Arizona and New Mexico—and Oklahoma also fall into this group.
- Utah has the largest difference between men’s and women’s labor force participation rates at 16.7 percentage points. Maine has the smallest at 5.8 percentage points (Table B2.1).
- Women’s labor force participation has increased in just 11 states and the District of Columbia since 2002. Louisiana and the District of Columbia have shown the largest gains, with increases of 3.6 and 3.3 percentage points, respectively. Idaho and Minnesota have experienced the greatest losses, with declines of 5.6 and 4.8 percentage points (IWPR 2004; Table 2.1).
Among the detailed racial and ethnic groups shown in Table B2.3, women of Bolivian and Peruvian descent have the highest labor force participation rates among Hispanic women at 70.1 and 66.0 percent, respectively, and women of Cuban descent have the lowest rate at 55.9 percent (Table B2.3). Women who identify as Filipino and Laotian have the highest workforce participation rates among Asian/Pacific Islander women (68.2 and 64.8 percent), and women who identify as Pakistani and Bangladeshi have the lowest rates (41.8 and 44.3 percent). Among Native American women, the Chippewa and the Pueblo have the highest workforce participation rates at 59.4 percent and 59.0 percent, respectively, and the Navajo and the Cherokee have the lowest rates (52.2 and 53.9 percent; Table B2.3).
Labor force participation rates also vary by age. Among women, rates are highest for those in their prime working years (aged 25–54); after increasing between 1960 and 1999, however, the labor force participation rate of women in this age group decreased nearly three percentage points between 2000 and 2014 (the labor force participation rate of men aged 25–54 declined by more than three percentage points during this time; Figure 2.6). The labor force participation rate for young women (16–24) reached its high point in 1987 and declined more than nine percentage points between 2000 and 2014, while young men’s labor force participation rate declined by more than twelve percentage points, reflecting the longer time this generation now spends in education and also a weak labor market during the Great Recession and in the slow recovery for many young adults. Among women aged 55 years and older—who are much less likely to be in the workforce than younger women—labor force participation has increased over the last three decades, especially so in the 2000s, having remained fairly constant from 1960 until the mid-1980s, when the labor force participation rate of young women was growing rapidly. In 2014, 34.9 percent of older women were in the workforce, compared with 26.1 percent in 2000. Older men, in contrast, experienced a steady decline in their workforce participation rates between 1960 and the mid-1990s, before their labor force participation rate increased between the mid-1990s and 2014, reaching its high point in 2012 (Figure 2.6).
Figure 2.6. Labor Force Participation Rates by Gender and Age, 1960–2014
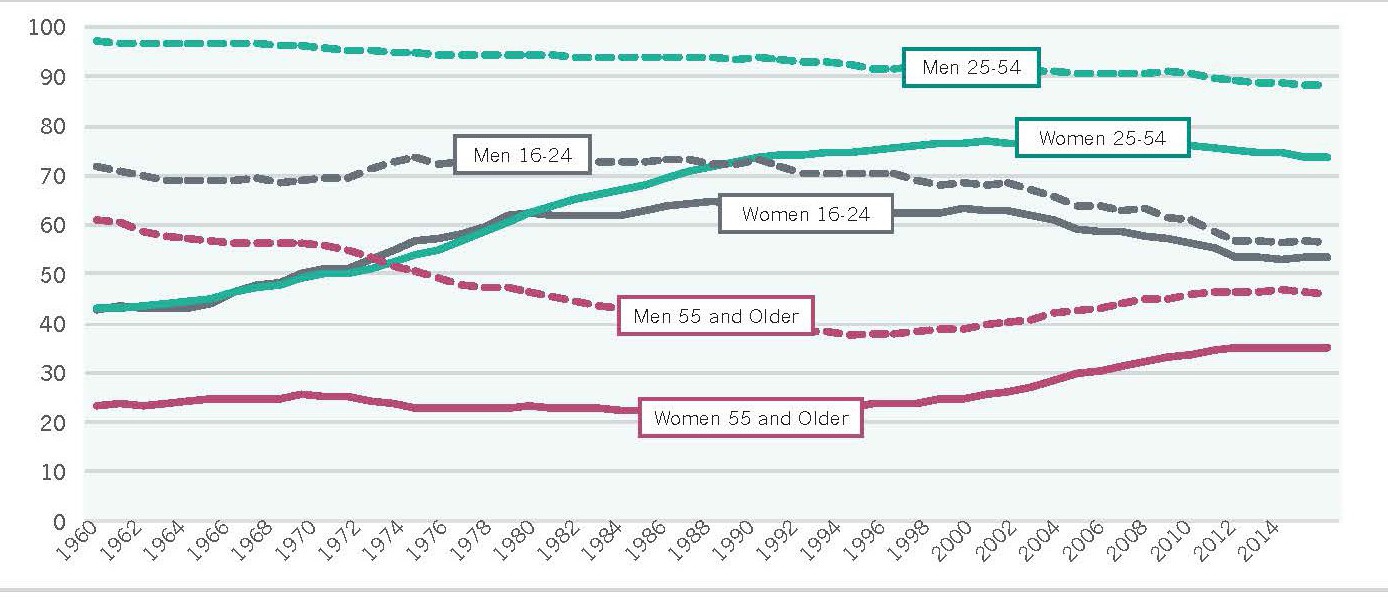 Source: IWPR compilation of Current Population Survey data from the U.S. Bureau of Labor Statistics (2015c).
Part-Time Work
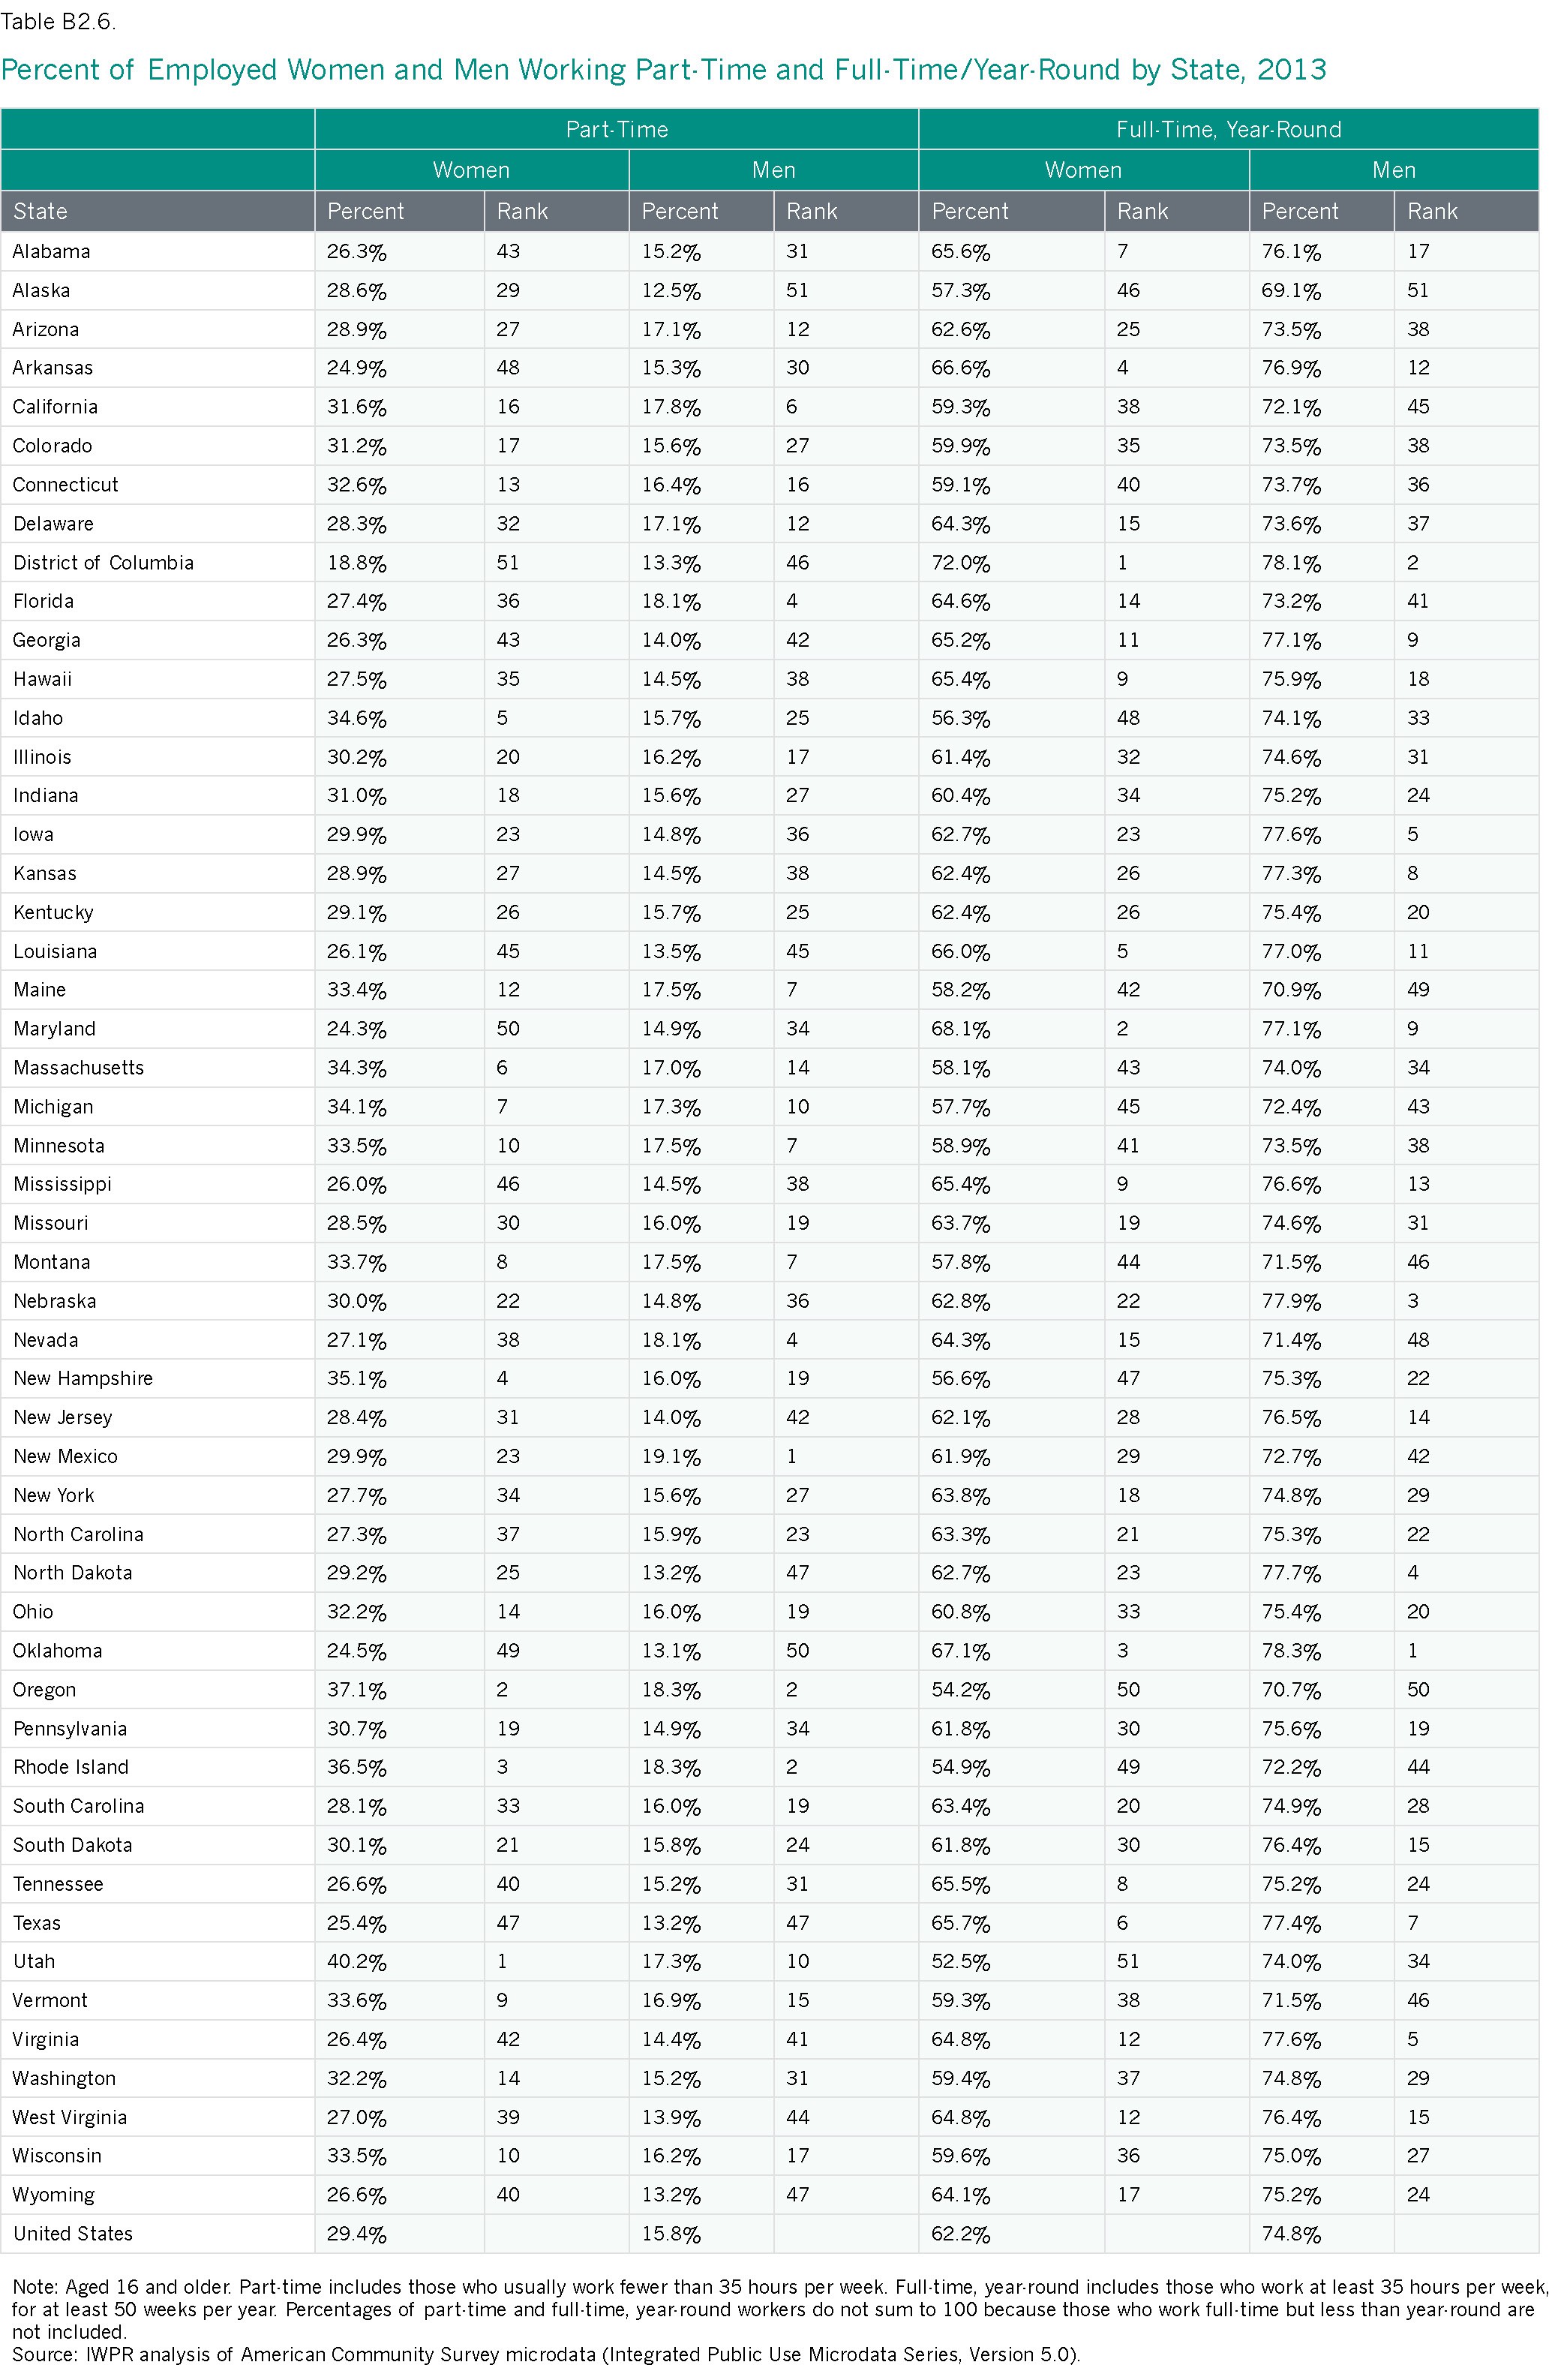
Although the majority of employed women and men in the United States work full-time, women are nearly twice as likely as men to work part-time (29.4 percent compared with 15.8 percent; Table B2.6).
Working part-time makes it less likely that a worker will receive employment benefits such as paid vacation days, paid family or medical leave, paid sick days, health care insurance, or employer contributions to retirement saving funds (Society for Human Resource Management 2011; Van Giezen 2012).
- Utah (40.2 percent), Oregon (37.1 percent), and Rhode Island (36.5 percent) have the largest percentages of employed women who work part-time.
- The District of Columbia (18.8 percent), Maryland (24.3 percent), and Oklahoma (24.5 percent) have the smallest percentages of employed women who work part-time. The percentage of employed women working part-time in the District of Columbia is roughly half that of Utah.
Women work part-time for various reasons. The majority who work part-time do so by choice (although these choices may be constrained by factors such as their children’s school hours and the high costs of child care). For some women, however, part-time work is involuntary; approximately one in five women who usually worked part-time in 2013 said they worked part-time because they could not find full-time work or had their hours at work temporarily reduced (IWPR 2014b).
Whether part-time work is voluntary or not, an increasing number of workers report not knowing from one week to the next how many hours and at what times they are expected to work. They may be expected to be available for full-time work, but without any guarantee of how many hours they actually will be scheduled to work. A recent national survey of younger workers between the ages of 26 and 32 found that approximately 70 percent of hourly and non-hourly women workers experience fluctuations in their hours worked per week. Such fluctuations are particularly common for workers classified as part-time (Lambert, Fugiel, and Henly 2014). In addition to potentially creating havoc with workers’ family lives, and their own and children’s school schedules, these unpredictable schedules can make it hard to secure a steady income that enables them to meet their financial needs. Unpredictable scheduling also can make it difficult for workers to combine two or more part-time jobs to increase earnings or combine part-time work with their own schooling.
Unemployment
Preliminary data from the Bureau of Labor Statistics show that in 2014, 6.1 percent of women aged 16 and older in the nation’s civilian, noninstitutionalized population were unemployed, compared with 6.3 percent of men (U.S. Bureau of Labor Statistics 2015d). These unemployment rates were the lowest for women and men since 2008, when 5.4 percent of women and 6.1 percent of men were unemployed (U.S. Bureau of Labor Statistics 2014b). This decrease in unemployment reflects improvement in the nation’s economy following the Great Recession that officially lasted from 2007 to 2009. The lower rates, however, may also reflect the decision of some workers to give up their active search for a job in the face of dim employment prospects (Davis 2014). As noted above, labor force participation rates have fallen, and some adults may have left the labor market out of discouragement.
In the United States, women’s unemployment rates vary considerably by race and ethnicity. According to preliminary data, black women in 2014 had the highest unemployment rate among women at 10.5 percent, followed by Hispanic women (8.2 percent), white women (5.2 percent), and Asian women (4.6 percent; data are not available for Native American women). For each racial and ethnic group except Hispanics, women’s unemployment rates were lower than men’s (U.S. Bureau of Labor Statistics 2015e).
Single mothers and young women also have high levels of unemployment. In 2013, single mothers with children under 18 were more than twice as likely to be unemployed as married mothers with a spouse present (12.0 percent compared with 4.8 percent; U.S. Bureau of Labor Statistics 2014c).7 According to preliminary data for 2014, the nation’s youngest female workers (aged 16–19) had an unemployment rate of 17.7 percent; those aged 20–24 fared better but still had a relatively high unemployment rate (10.1 percent; U.S. Bureau of Labor Statistics 2015d). Many young women face the dual disadvantage of having limited or no prior work experience and a lack of higher educational credentials.
The Employment and Earnings of Immigrant Women
Approximately 21 million female immigrants live in the United States, making up just over 13 percent of the nation’s female population. Immigrant women come from all over the world, with the largest shares from Mexico (25.6 percent), the Philippines (5.3 percent), China (4.7 percent), and India (4.6 percent). In their multiple roles as students, professionals and other workers, spouses, parents, and caregivers, immigrant women make important contributions to local communities, the economy, and society.
- Immigrant women are less likely than U.S.-born women to be in the labor force (56.2 percent compared with 59.0 percent). While many immigrant women are thriving in the workforce, others encounter challenges that hinder their workforce participation or limit their access to higher quality employment. These challenges include the same barriers all women face—such as the undervaluation of work performed predominantly by women and the lack of a work-family infrastructure—and often additional challenges as well, such as limited English proficiency and, for those who are undocumented, lack of access to legal status (Hess, Henrici, and Williams 2011; Hess and Henrici 2013).
- Median annual earnings for immigrant women working full-time, year-round in 2013 were $32,000, which was much less than the earnings for U.S.-born women ($39,000). Among the ten largest sending countries for female immigrants—Mexico, the Philippines, China, India, Vietnam, Korea, El Salvador, Cuba, the Dominican Republic, and Canada—immigrant women’s earnings varied considerably. Women from India had the highest earnings at $65,000—well above the median earnings for all women of $38,000—and women from Mexico had the lowest earnings at $22,000. These differences likely stem, in part, from differences in levels of education; immigrant women from India typically have more years of higher education.
- Immigrant women overall are less likely than U.S.-born women to work in managerial or professional occupations (32.7 percent compared with 41.1 percent).
- Immigrant women are disproportionately represented in service occupations. One in three (32.5 percent) immigrant women work in these occupations, compared with 19.9 percent of U.S.-born women. Immigrant women are also nearly twice as likely as U.S.-born women to work in production, transportation, and material moving occupations (9.9 percent compared with 5.0 percent). They are less likely than U.S.-born women to work in office and administrative support occupations (13.3 percent of employed immigrant women work in these occupations compared with 21.5 percent of employed U.S.-born women) and in professional and related occupations (21.8 percent compared with 27.0 percent).
IWPR calculations based on 2013 American Community Survey microdata.
The Employment and Earnings of Women with Disabilities
Approximately 2.6 million women aged 16 and older in the labor force have disabilities, including cognitive, ambulatory, sight, hearing, and self-care or independent living difficulties. They are 3.6 percent of all women in the labor force.
- The labor force participation rate of women aged 16 and older with disabilities in 2013 was 17.1 percent, compared with 62.7 percent of women without disabilities.
- Finding work is harder for women with a disability than for other women. In 2013, the rate of unemployment for women with a disability was 13.5 percent, compared with 6.8 percent for women without a disability.
- Women with disabilities are more likely to work part-time. The percentage of women with disabilities working part-time in 2013 was 38.4 percent, compared with 28.9 percent of women without disabilities.
- Women with disabilities are about as likely as other women to work in sales and office occupations (31.8 and 30.4 percent, respectively) and slightly more likely to work in service occupations (24.8 and 21.6 percent). They are less likely to work in management, professional, and related occupations (34.9 percent of women with disabilities and 41.8 percent of women without disabilities).
- Women aged 16 and older with disabilities who work full-time, year-round report lower earnings than those without disabilities ($32,500 compared with $38,000).
Earnings data and data on part-time work are based on IWPR analysis of 2013 American Community Survey microdata; all other data are from the U.S. Bureau of Labor Statistics (2014d).
Gender Differences in Employment by Industry
In the United States, gender differences persist across industries. An industry sector encompasses all employees of a firm or organization, whether they work as a janitor, secretary, accountant, or information technology specialist. Employment in services such as health care, nongovernmental education, leisure, and other services account for more than four in ten women’s jobs (nationally 43.2 percent), but only one in four men’s jobs (24.8 percent; Table 2.4). The construction industry (1.3 percent of women and 11.1 percent of men), manufacturing (6.6 percent of women and 14.4 percent of men), and transportation and communications (3.0 percent of women and 7.8 percent of men) together account for the jobs held by only one in nine employed women but almost one-third of those held by employed men (Table 2.4).
The different industries in which women and men work affect their economic status. During the Great Recession of 2007 to 2009, for example, job losses were particularly high in construction and manufacturing while jobs in the health and education sector grew, resulting in differences in the size and timing of job losses and gains experienced by women and men (Hartmann and English 2010). In the five years after the official end of the Great Recession in June 2009, jobs in health care and education grew by almost two million, benefiting mainly women, while jobs in construction grew by only 7,000 (with net growth only for men; Hartmann, Shaw, and O’Connor 2014).
Table 2.4. Distribution of Women and Men Across Industries and Gender Earnings Ratio, United States, 2013
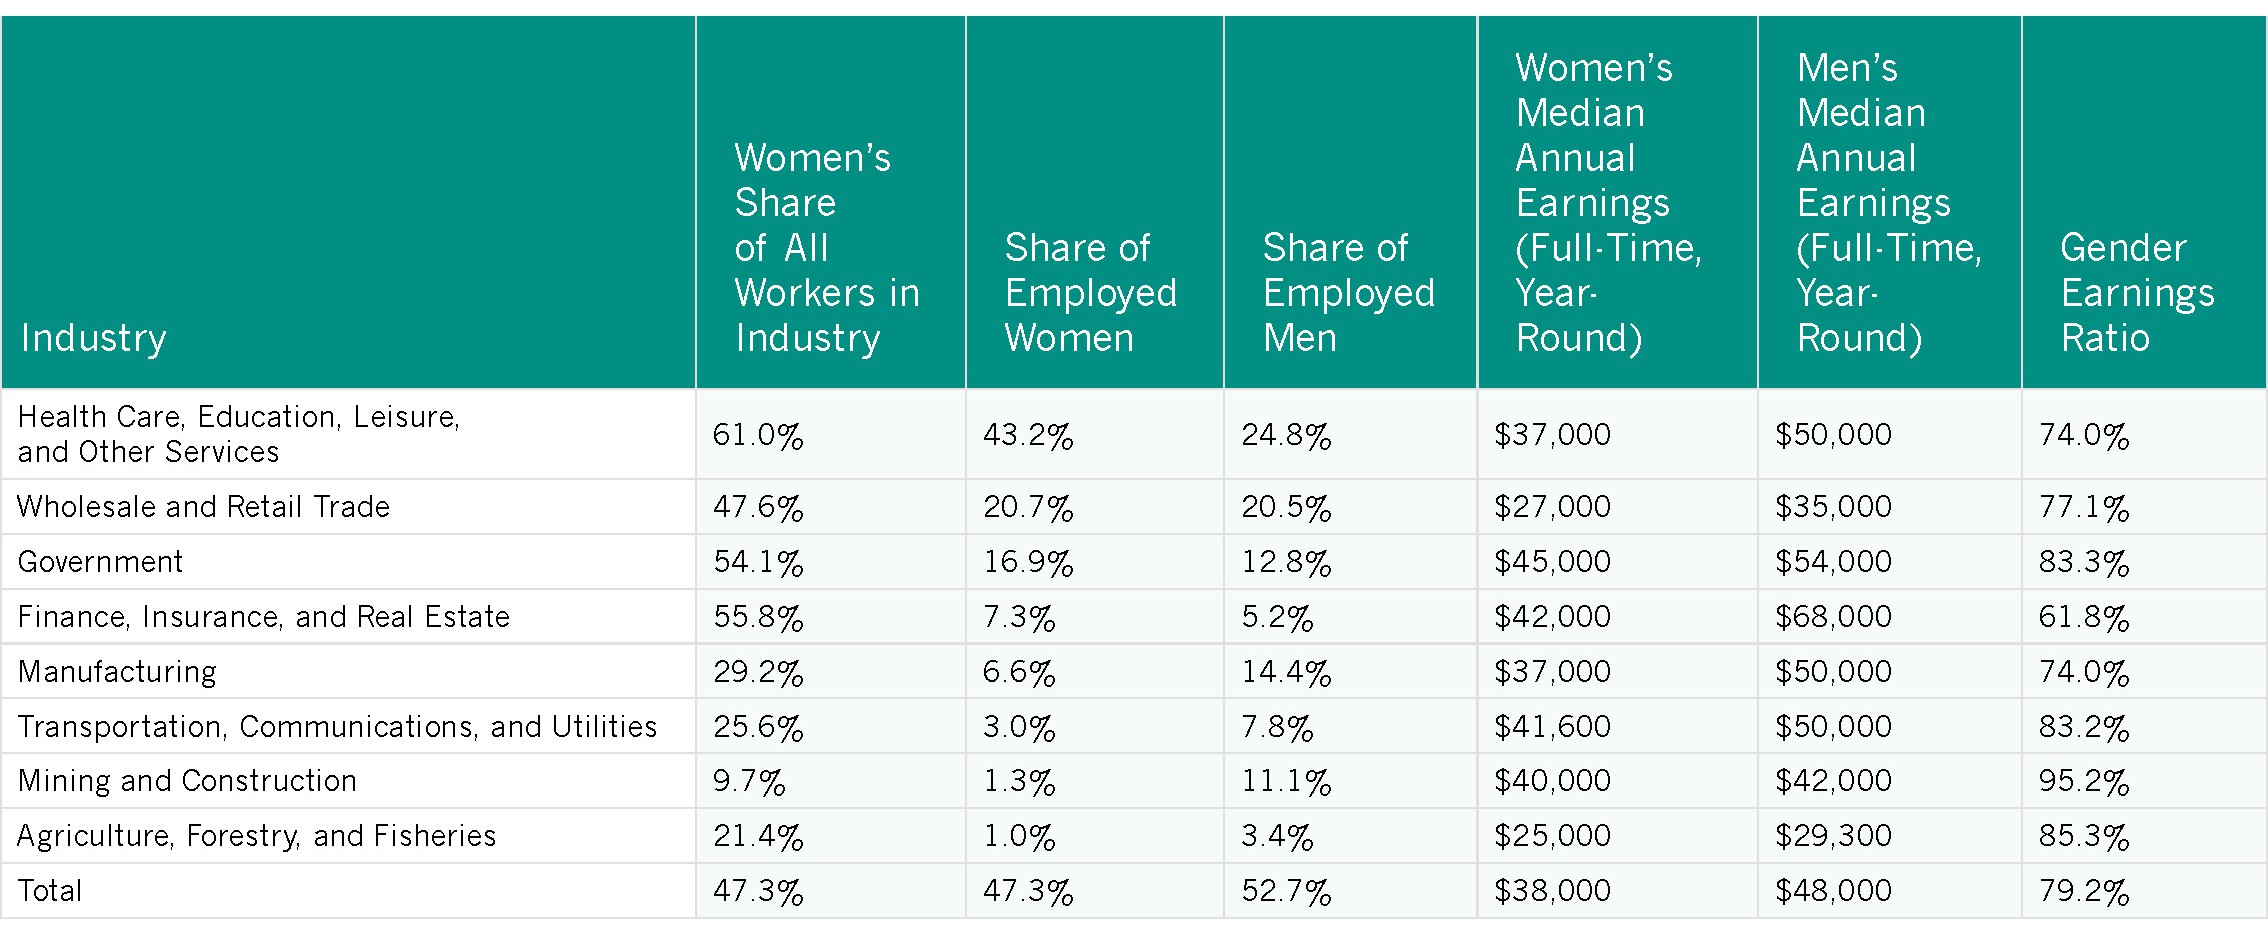 Note: For employed women and men aged 16 and older; earnings data are for full-time, year-round workers. All public sector workers are in “government”; other workers are private sector employees.
Source: IWPR analysis of American Community Survey microdata (Integrated Public Use Microdata Series, Version 5.0).
Median annual earnings and the gender earnings ratio for full-time, year-round work differ substantially across industries. Women in government (which includes federal government as well as state and local services such as police and education) have the highest median earnings ($45,000) and a narrower gender earnings ratio than the one for all women and men (83.3 compared with 79.2 percent; Table 2.4). Among the industries shown in Table 2.4, the gender earnings ratio is widest in finance, insurance, and real estate (61.8 percent) and narrowest in mining and construction (95.2 percent), an industry that employs proportionately far fewer women than men. Manufacturing provides middle income jobs to women, with median annual earnings of $37,000, but median earnings for men in these jobs are substantially higher at $50,000 (resulting in a gender wage ratio of 74.0 percent).
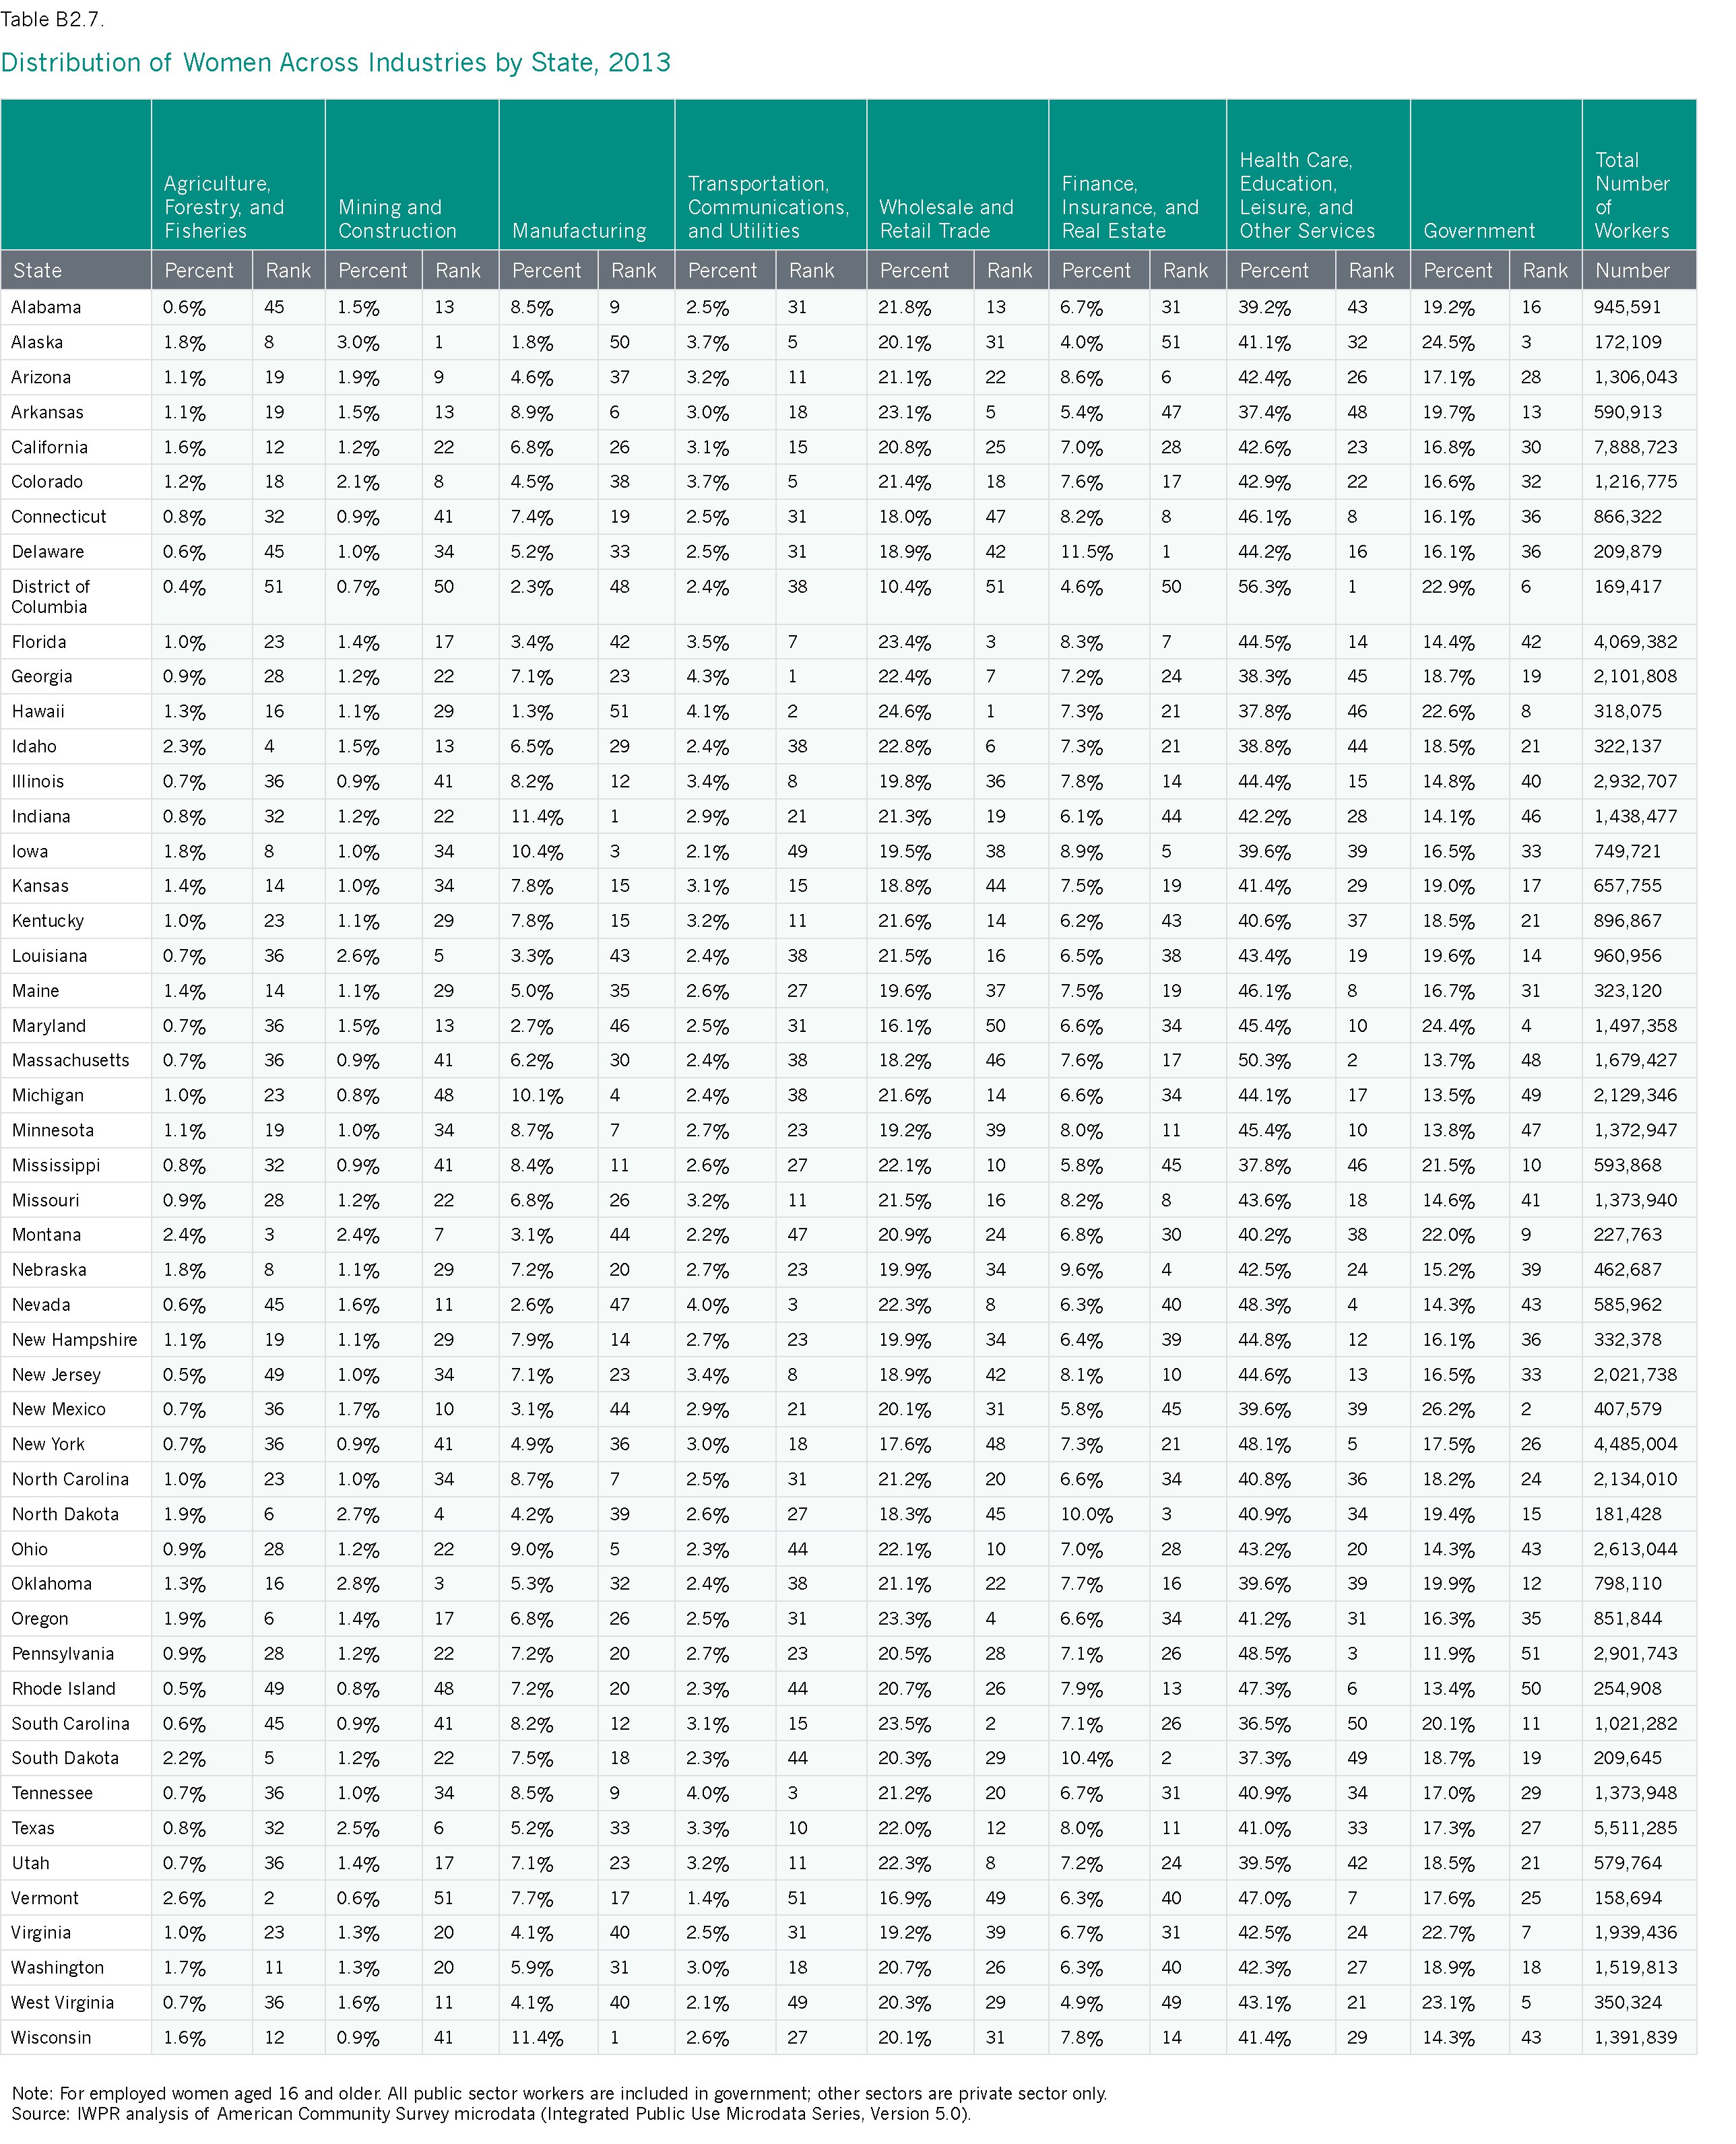
- The share of employed women who work in government, the best paying industry for women, is highest in Wyoming (29.2 percent) and lowest in Pennsylvania (11.9 percent; Table B2.7).
- Employed women are the most likely to work in finance, insurance, and real estate—the industry with the widest gender earnings ratio—in Delaware (11.5 percent), and least likely to work in this industry in Alaska (4.0 percent).
- In four states—Indiana and Wisconsin (11.4 percent each), Iowa (10.4 percent), and Michigan (10.1 percent)—at least one in ten employed women work in manufacturing (Table B2.7).
Gender Differences Across Occupations
Nationally, 39.9 percent of employed women and 33.0 percent of employed men work in professional or managerial occupations (Table B2.1). This category encompasses a range of occupations—from management, lawyers, doctors, nurses, teachers, and accountants to engineers and software developers—that mostly require at least a college degree. The percentage of employed women working in these occupations has increased since the 2004 Status of Women in the States report, when 33.2 of working women held professional or managerial jobs. These jobs offer opportunities for higher earnings for women, although typically even more so for men; women who work in managerial or professional occupations often earn substantially less than men (Table 2.5). The three jurisdictions with the highest shares of women working in professional or managerial occupations—the District of Columbia, Maryland, and Massachusetts—also have the highest median annual earnings for women (Table 2.1).
Women are much more likely than men to work in professional and related occupations (26.2 compared with 17.5 percent, respectively) but slightly less likely than men to work in management, business, and financial occupations (13.7 compared with 15.4 percent; Table 2.5). Women are also much more likely than men to work in service occupations (Table 2.5), which include personal care aides, home health aides, nursing assistants, cooks, and food service staff—occupations that are projected to see high growth in the coming years, but which have median annual earnings for women of less than $25,000 per year (Table 2.5). According to IWPR analysis of 2013 American Community Survey microdata, one-third of employed Hispanic women (32.2 percent) and more than one in four employed black (28.2 percent) and Native American (27.4 percent) women work in service occupations, compared with 20.6 percent of Asian/Pacific Islander women and 18.3 percent of white women.8
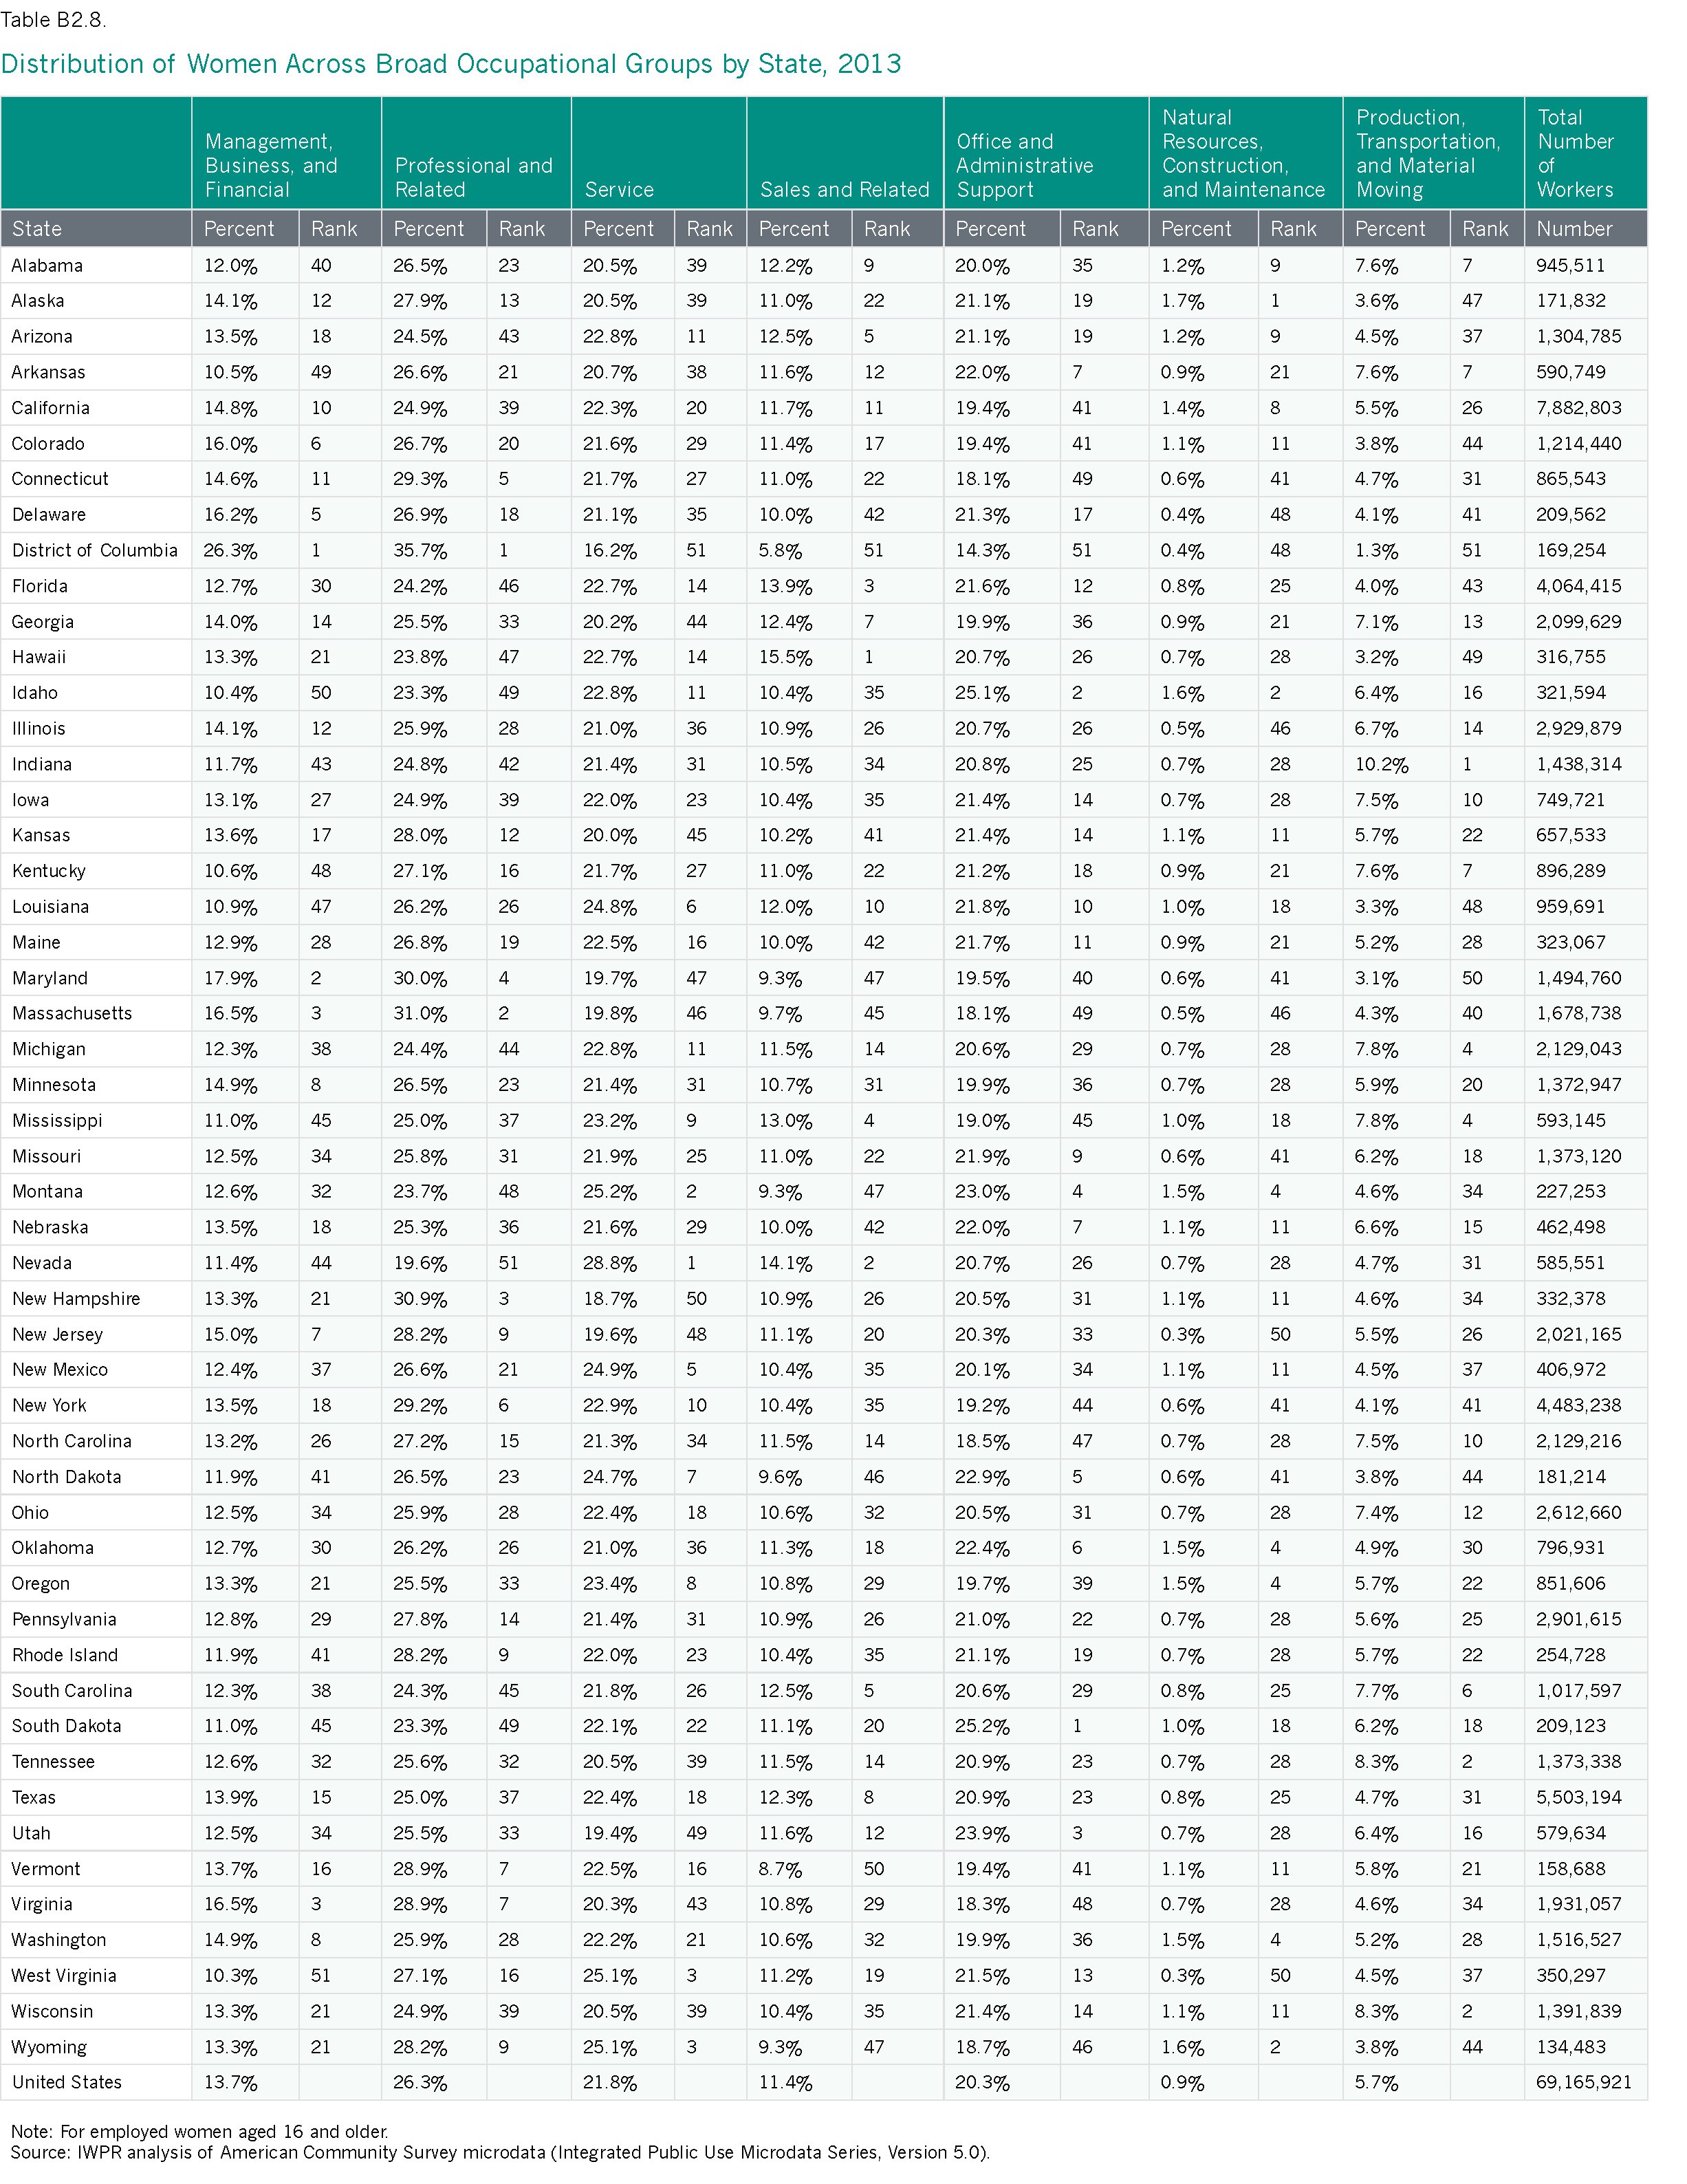
- Nevada has the highest proportion of women working in service occupations (28.8 percent of employed women). In six other states—Louisiana, Montana, New Mexico, North Dakota, West Virginia, and Wyoming—one-quarter of employed women work in service occupations (Table B2.8).
- Women are least likely to work in service occupations in the District of Columbia (16.2 percent), New Hampshire (18.7 percent), and Utah (19.4 percent).
Table 2.5. Distribution of Women and Men Across Broad Occupational Groups and Gender Earnings Ratio, United States, 2013
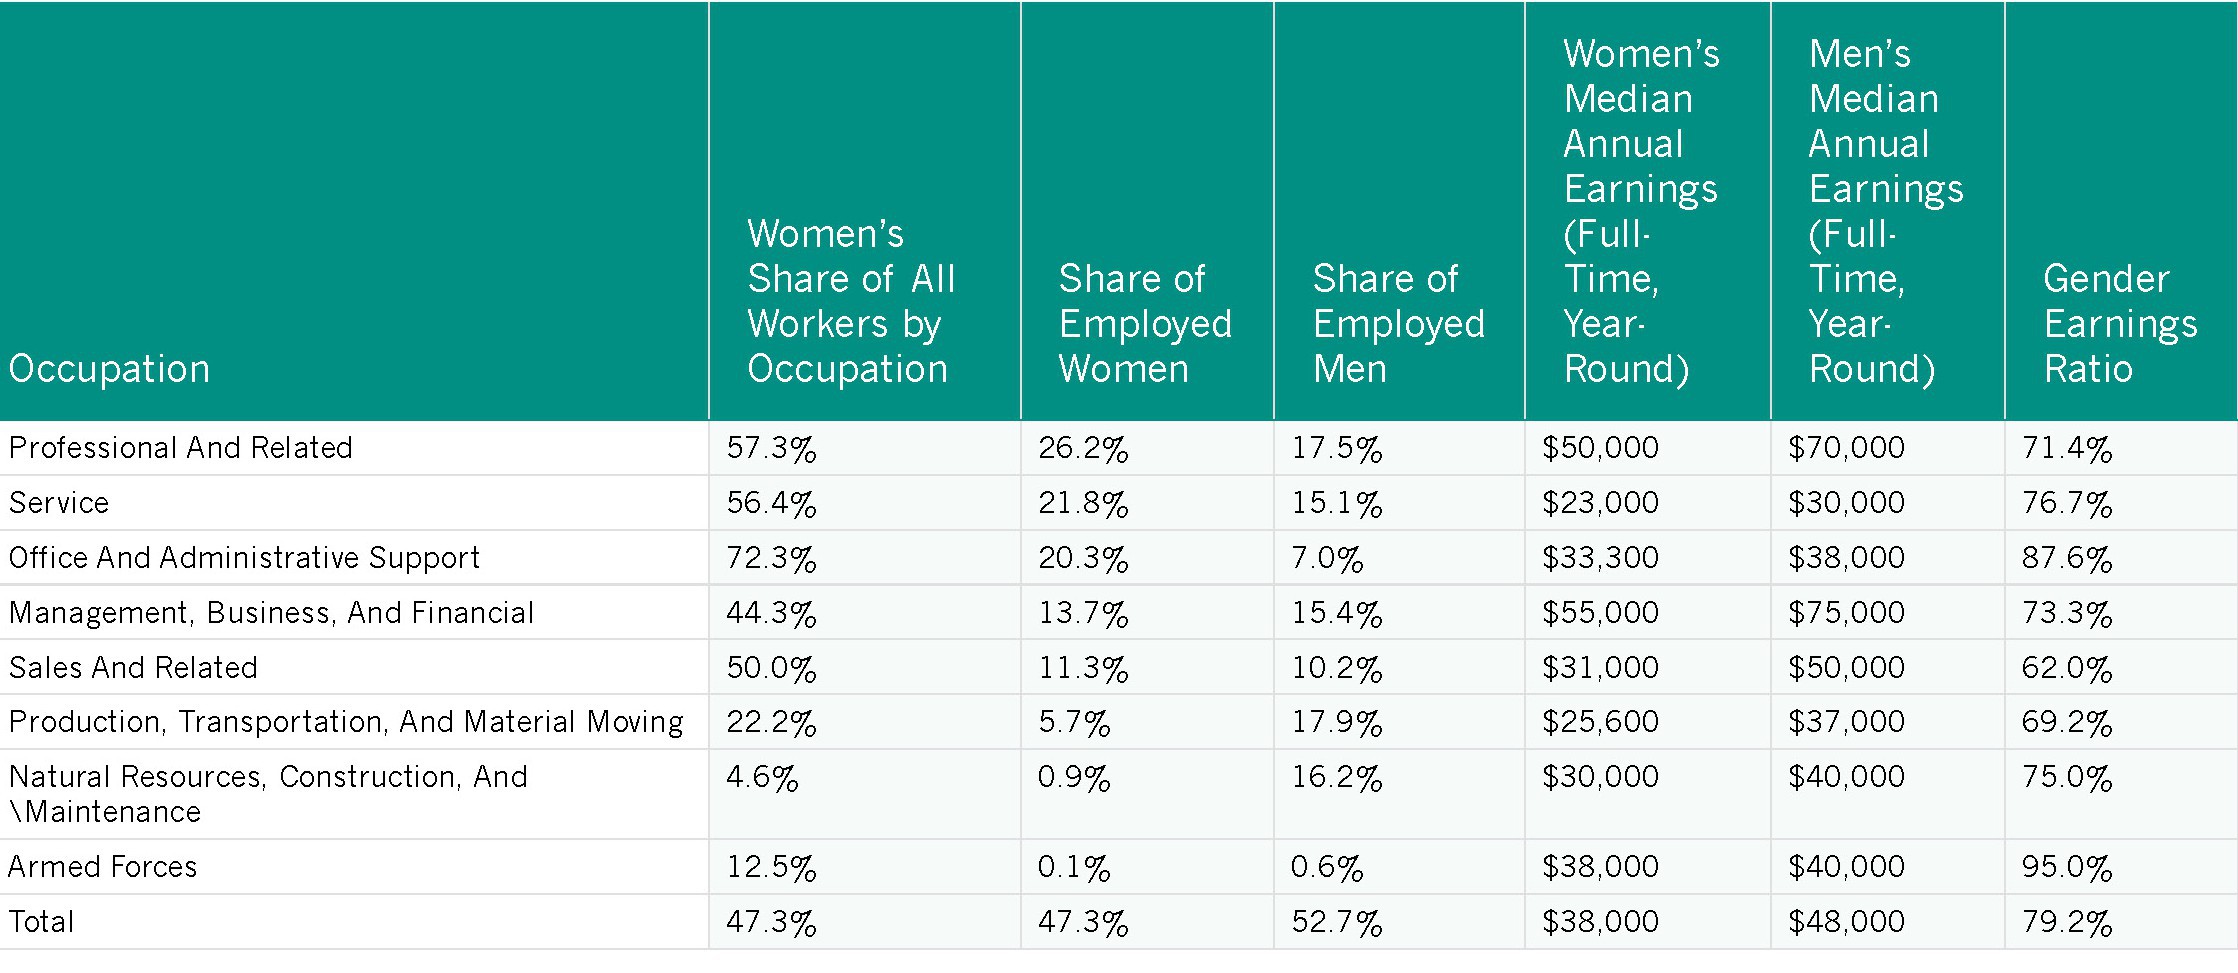
Note: For employed women and men aged 16 and older.
Source: IWPR analysis of American Community Survey microdata (Integrated Public Use Microdata Series, Version 5.0).
Women in STEM Occupations
Science, technology, engineering, and mathematics (STEM) occupations have experienced much faster growth than other occupations in the last decade and play a key role in the sustained growth and stability of the U.S. economy (U.S. Department of Commerce 2011). These fields are among the higher paid; IWPR analysis of 2013 American Community Survey microdata indicates that in 2013, median annual earnings in STEM occupations requiring a university degree were $64,000 for women and $78,000 for men.9 Yet, women are less likely to go into STEM fields than men; only 4.6 percent of women work in STEM occupations, compared with 10.3 percent of men (Table B2.9).
The percentage of women working in STEM occupations varies across the largest racial and ethnic groups. IWPR analysis of American Community Survey microdata finds that Asian/Pacific Islander women are the most likely to work in these occupations (11.3 percent of employed Asian/Pacific Islander women), followed by white women (4.9 percent), black women (2.8 percent), and Native American and Hispanic women (2.3 percent each).
- Women are most likely to work in STEM occupations in the District of Columbia (10.6 percent), Maryland (7.5 percent), and Massachusetts (7.0 percent; Table B2.9), the three states with the highest median annual earnings for women (Table 2.1).
- Women are least likely to work in STEM occupations in South Dakota (2.6 percent), Mississippi (3.1 percent), and Louisiana (3.2 percent).
- Nationally, women are 28.8 percent of STEM workers. Women are less likely than men to work in STEM occupations in every state, but their shares of STEM occupations vary considerably (Table B2.9).
- Women make up the highest share of STEM workers in the District of Columbia (44.2 percent), followed by Maryland (34.4 percent), Vermont (33.6 percent), and Wyoming (33.0 percent).
- Women are less than one-quarter of STEM workers in two states: Utah (23.5 percent) and New Hampshire (24.6 percent).
- The differences in occupations in which women and men work are just one factor indicating that much more progress needs to be made before women can achieve equality in the workforce. Occupational segregation continues to be a persistent feature of the U.S. labor force, with the occupations in which women are concentrated paying less than those in which men are concentrated. Women’s participation in the labor force has declined since 2002, and women in all states across the nation continue to earn less than men. In addition, despite signs of progress, the gender wage gap is not expected to close nationally until 2058 if progress continues at the current rate since 1960 (and not until a full century later in Wyoming, the last state expected to close the gap). These findings point to the need for policies and practices that can accelerate the pace of change for women and improve their status in the area of employment and earnings in all states and the nation overall.
Appendix Tables

Notes
1The earnings estimate for 2013 is based on the Current Population Survey (CPS), the official dataset for national earnings, and the same dataset used for the 2002 estimate. It differs from earnings estimates based on the American Community Survey (ACS), the primary dataset used in this report. IWPR’s national estimate of median annual earnings for full-time, year-round workers based on analysis of the ACS is $38,000 for women and $48,000 for men in 2013. This report relies on the ACS because the ACS’s larger sample size makes it possible to provide data disaggregated by race/ethnicity on women’s earnings at the state level. Differences in estimates based on the ACS and CPS may be due to the use of different time periods for reporting annual earnings as well as differences in the method of data collection; ACS data are largely collected by self-enumeration, whereas the CPS interviews are computerized personal and telephone interviews conducted by trained Census interviewers. Earnings estimates based on the CPS are for the population aged 15 and older; IWPR’s estimates based on analysis of the ACS are for the population aged 16 and older.
2Both the 2004 and 2014 estimates are based on the CPS; estimates based on the ACS differ slightly. IWPR’s estimates of labor force participation in 2013 based on analysis of the ACS are 58.6 percent for women aged 16 and older and 68.9 percent for men (see Table B2.1). The Bureau of Labor Statistic’s estimates for 2013, based on the CPS, are 57.2 percent for women and 69.7 percent for men aged 16 and older. Differences based on the ACS and CPS may be due to different time periods for reporting labor force activity as well as sampling variability, questionnaire structure, and mode of data collection.
3The comparatively high earnings of women in some states are, to some extent, offset by higher costs of living in these areas. In general, places such as the District of Columbia, New England, Alaska, Hawaii, and the West Coast have higher costs of living than the Midwestern and Southern states (Missouri Economic Research and Information Center 2015).
4Earnings estimate for 1980 is for the civilian workforce only.
5For additional IWPR data on the employment and earnings of millennial women, see the March 2015 issue of Glamour Magazine, pp. 274–277.
6Earnings are calculated for all workers and are not controlled for education or sector of employment; when controlled for these factors, the union advantage is smaller but still significant, especially for women and minorities (Jones, Schmitt, and Woo 2014).
7Single mothers include those who are never married, married with an absent spouse, divorced, separated, or widowed.
8Although the share of Asian/Pacific Islander women overall who work in service occupations is slightly lower than the national average for all women, there is considerable variation among Asian/Pacific Islander groups. For example, three in ten (30.4 percent) Vietnamese workers are employed in service occupations (30.4 percent), compared with less than one in ten (6.7 percent) Indian workers. Data are not available by gender (U.S. Department of Commerce 2015).
9This analysis uses the Bureau of Labor Statistics’ definition of STEM occupations, which includes the social sciences and managers of STEM workers, but excludes support occupations, health occupations, and most technical and trade occupations that do not require a four-year degree (U.S. Bureau of Labor Statistics 2012). Rothwell (2013) and Carnevale, Smith, and Melton (2011) also find a wage advantage for STEM related occupations not requiring a four-year degree.