Work & Family

A
B
C
D to F

In this Section

Work & Family

Women make up almost half of the workforce. Few families have someone who can stay at home to take care of health emergencies, pick children up from school and supervise homework, or take an elderly parent to a doctor’s appointment. In half of all families with children, women are the primary or co-breadwinner1 (IWPR 2015a). Low-income families are particularly likely to have all parents in the labor force (Boushey 2014). Yet, as mothers’ labor force participation has dramatically increased in the past decades (U.S. Bureau of Labor Statistics 2014) and the number of women and men aged 50 and older who provide care for a parent has tripled during the last 15 years (MetLife 2011), the development of an infrastructure to support workers with family caregiving responsibilities has been largely neglected. Many workers lack access to even the most basic supports such as earned sick days and job-protected paid parental leave. Quality child care is also out of reach for many families because it is not affordable. Women are the large majority of family caregivers, and in the absence of reliable family supports, too many women are forced to make difficult decisions between keeping their jobs and caring for their family members.

View All State Rankings
Best Worst
1. New York 51. Indiana
2. California 50. Utah
3. District of Columbia 49. Montana
4. New Jersey 48. Mississippi
5. Rhode Island 47. Wyoming

Paid Leave and Paid Sick Days

Everyone is likely to need to take leave from work at some time due to personal illness, the demands of parenthood, or the need to provide care for someone in their family. Because women are the majority of those providing care for children as well as elderly and disabled adult family members, and because of their greater need for leave related to pregnancy and childbirth, having access to job-protected paid leave is particularly important for them. Research has documented the benefi ts of paid leave for women and their families and the negative effects of not having access to leave. Paid leave helps women remain in the labor force when faced with caregiving responsibilities—whether the caregiving is for a baby, child, parent, or spouse—and the continuous attachment to the labor force can also help them advance in their careers. Paid leave for men can help address the unequal division of caregiving tasks between women and men and can reduce the potential of stereotyping and discrimination against women if they are the only ones making use of paid leave benefits (Patnaik 2015). The United States is one of only two countries in the world without a national paid maternity leave law, and one of a small minority of high-income countries that does not require employers to provide paid sick days (Earle, Mokomane, and Heymann 2011; International Labour Organisation 2014; Ray, Sanes, and Schmitt 2013).

Read More See the Data
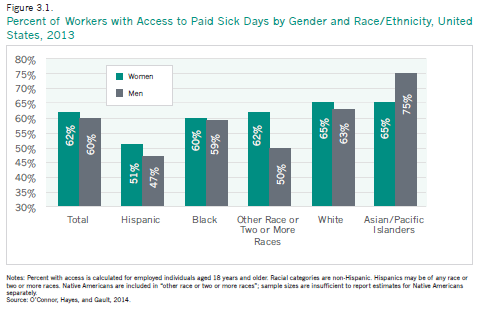
Figure 3.1
Percent of Workers with Access to Paid Sick Days by Gender and Race/Ethnicity, United States, 2013 Women Men

White

65%

63%

Hispanic

51%

47%

Black

60%

59%

Asian/Pacific Islanders

65%

75%

Other Race or Two or More Races

62%

50%

Total

62%

60%

Percent with Access to Employer-Provided Paid Leave Benefits for Full-Time and Part-Time Workers, 1992/3 and 2012

Paid Vacation Days

Paid Sick Days

Paid Family Leave

Full-time workers 1992/3

92

58

2

Full-time workers 2012

91

75

13

Part-time workers 1992/3

40

16

1

Part-time workers 2012

35

23

4

Note: Percent of workers with access to paid sick days are calculated for employed individuals age 18 years and older that responded yes or no to the following question: Do you have paid sick leave on your main job or business? “Other not Hispanic” category includes American Indian or Alaska natives, and individuals reporting multiple racial identities. None of these populations were individually large enough for separate analysis; all were kept in the interest of inclusion. Percent with access to employer-provided paid leave benefits includes private employers only. National Compensation Survey data for 1992 and 1993 were combined to create a sufficient sample for analysis.
Source: Data for percent of workers with access to paid sick days is Institute for Women’s Policy Research (IWPR) analysis of the 2013 National Health Interview Survey (NHIS). Data for percent with access to employer-provided paid leave benefits is IWPR compilation of data from Van Giezen 2013.


Elder and Dependent Care

A quarter of the adult population under the age of 65 (24 percent) and an even larger share of those older than 65 (39 percent) have one or more disabilities (Centers for Disease Control and Prevention 2015; West et al. 2014). While many elderly people and many people with disabilities live healthy and independent lives, indeed, may provide support—financial or otherwise—for their families rather than needing support, many others rely on the care of family members to function. According to the 2009 National Caregiving Study, 66 million people provided informal care to an adult during that year, and over 40 million provided care for an adult in need of assistance with daily living (National Alliance for Caregiving and AARP 2009a,b).

Read More See the Data
Women’s Share of All Part-time Workers by Reason for Part-time Work, 2013

All who usually work part-time

63.8%

Retired or Social Security limit on earnings

49.2%

Slack work or business conditions

51.4%

In school or training

56.5%

Could find only part‐ time work

59.0%

Other family or personal obligations

90.1%

Child care problems

93.9%

Notes: Part-time workers are those who usually work between 1 and 34 hours per week. Women’s share of all part-time workers is shown as the “main reason” for working part-time given by respondents.
Source: IWPR calculations based on U.S. Bureau of Labor Statistics 2013b.


State and Local Laws to Support Caregivers at Work

Caregiver discrimination: A number of states have passed laws to protect family caregivers from discrimination at work (such as being fired for needing leave or denying leave for caregiving reasons or not being hired or promoted because one has caregiving responsibilities; Redfoot, Feinberg, and Smith Fitzpatrick 2014; Williams, Devaux, Petrac, and Feinberg 2012). The U.S. Equal Employment Opportunity Commission (EEOC) has clarified that both under Title VII of the Civil Rights Act and under the Americans with Disabilities Act it constitutes discrimination for an employer to treat a person adversely because he or she is a family caregiver or “associated with a person with a disability” (U.S. EEOC 2007). A number of states have issued laws to extend protections for family caregivers beyond what is covered in federal laws; most statutory protections in this field, however, have happened at the local level in cities and districts (Williams et al. 2012).

Read More
LARGE care worker with elderly woman

Mothers as Breadwinners

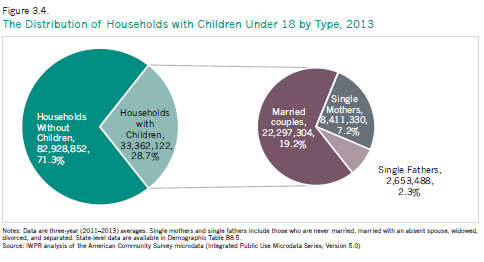
The large majority of mothers are in the workforce, including 62 percent of mothers who gave birth within the last 12 months (U.S. Department of Labor Women’s Bureau 2015). One in three workers (32 percent) have children under 18, and of these, a quarter have children younger than 6 years old (U.S. Bureau of Labor Statistics 2014). Of the 33.4 million households with children under 18, 22.3 million are headed by married couples, 8.4 million by single mothers, and 2.7 million by single fathers (Figure 3.4). Married fathers also spend more time on child care than previously. Both mothers and fathers need accommodations at work, such as schedule flexibility.

Read More See the Data
Figure 3.4
Breadwinner Mothers in Households with Children under 18, 2013

Number

Percent

Households With Children Under 18*

         33,280,267

28.6%

Households with a Breadwinner Mother** as Percent of all Households with Children

49.8%

Single Mothers as Percent of All Female Breadwinners**

50.7%

Married Couples With Female Breadwinner** as Percent   of All Married Couples

37.4%

Notes: Data are three-year (2011–2013) averages. *As percent of all households in the state. **A breadwinner mother is defined as a single mother who is the main householder (irrespective of earnings) or a married mother who earns at least 40 percent of the couple’s joint earnings; single mothers who live in someone else’s household (such as with their parents) are not included.
Source: IWPR analysis of American Community Survey microdata (Integrated Public Use Microdata Series, Version 5.0).


Child Care

Reliable child care support is essential for parents’ employment. Quality early care and education also promote children’s school readiness and have positive effects that last into adulthood (Yoshikawa et al. 2013) and are important for developing economically vibrant communities (Warner 2009). State policies on child care and early care and education diff er on many aspects, including access and aff ordability of provisions, the number of hours provided by public programs, the training and supports available to/required of providers and teachers, after school and school vacation care, subsidies for low-income parents, and guidance provided to parents choosing providers (see for example Barnett et al. 2013; Child Care Aware of America 2013 and 2014a; Minton and Durham 2013; QRIS Compendium 2015; Schmit and Reeves 2015; Schulman and Blank 2013). The child care component of the work and family composite index focuses on just three indicators: the costs of full-time center care for an infant as a proportion of the median annual earnings for women in the state, a measure chosen to illustrate the potential barriers created by the costs of care for families considering having children generally and particularly for mothers of young children who want to return to work; the share of four-year-olds who are in publicly funded Pre-K, Headstart, and Special Education; and policies in place to ensure quality of Pre-K care (each is discussed in greater detail below). States vary widely across these indicators.

Read More See the Data
woman with laptop and child
Percent of Children Eligible under Federal Child Care Subsidy Parameters Who Received Child Care Subsidies, by Age and Poverty Status, 2011

All Eligible Children

Less than 100 % Poverty

Infants

12%

25%

Ages 1-2

28%

56%

Ages 3-4

30%

62%

Ages 5-12*

12%

27%

Notes: Children living in households with incomes less than 85 percent of state median household incomes are eligible under federal parameters, subject to their parents’ meeting work or training rules; states can set more restrictive eligibility rules. *Includes eligible children with a disability under the age of 19.
Source: IWPR compilation based on ASPE (2015).


The Gap in Mothers' and Fathers Labor Force Participation Rates

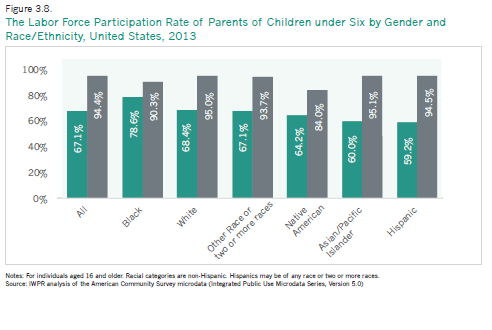
During the past four decades, the labor force participation rate for mothers of children under six has more than doubled, from just under a third (32.1 percent) in 1970 to just over two thirds (67.1 percent) in 2013 (IWPR 2015a). During the same period, the labor force participation rate of fathers hardly changed at all, falling from 97.9 percent in 1970 to 94.4 percent in 2013. Trends in the allocation of time between paid work, child care, and housework between 1975 and 2011 show that both mothers and fathers of young children now spend more time on these three activities than they did forty years ago (Figure 3.7). Yet, while mothers spend more time in paid work and fathers more time on housework and child care, overall mothers still do the large majority of family work and fathers still do the majority of paid work.

Read More See the Data
Figure 3.8
Time Spent on Paid Work, Housework, and Child Care, Mothers and Fathers, 1975 and 2011 Paid Work (hrs/wk) Housework (hrs/wk) Child Care (hrs/wk)

Mothers 1975

14.9

23.6

8.6

Mothers 2011

21.4

17.8

13.5

Fathers 1975

41.4

6.0

2.6

Fathers 2011

37.1

9.8

7.3

Labor Force Participation Rate of Parents of Children under Six by Gender and Race/Ethnicity, United States, 2013

Mothers

Fathers

All

67.1%

94.4%

Black

78.6%

90.3%

White

68.4%

95.0%

Other Race or Two or More Races

67.1%

93.7%

Native American

64.2%

84.0%

Asian/Pacific Islanders

60.0%

95.1%

Hispanic

59.2%

94.5%

Note: Time spent by mothers and fathers, 1975 and 2011, includes resident parents of children under 18. Labor force participation of parents includes individuals aged 16 and older. Racial categories are non-Hispanic. Hispanics may be of any race or two or more races. Native Americans are included in “other race or two or more races;” sample sizes are insufficient to report estimates for Native Americans separately.
Source: Time spent by mother and fathers, 1975 and 2011, is IWPR compilation of data from Pew Research Center 2015. Labor force participation of parents is IWPR analysis of the American Community Survey microdata (Integrated Public Use Microdata Series, Version 5.0).


View Additional Data by State

View additional tables with state-level data on the indicators discussed in this section.

View Additional Data by State
Back to Top

Download the Data

State-level data are available on paid leave legislation, percent of women living with a person with a disability, elder and dependent care indicators, breadwinner mothers, child care indicators, child care subsides, and the gender gap in parents labor force participation rates.