Employment & Earnings

A
B
C
D to F

In this Section

Trends in Employment and Earnings

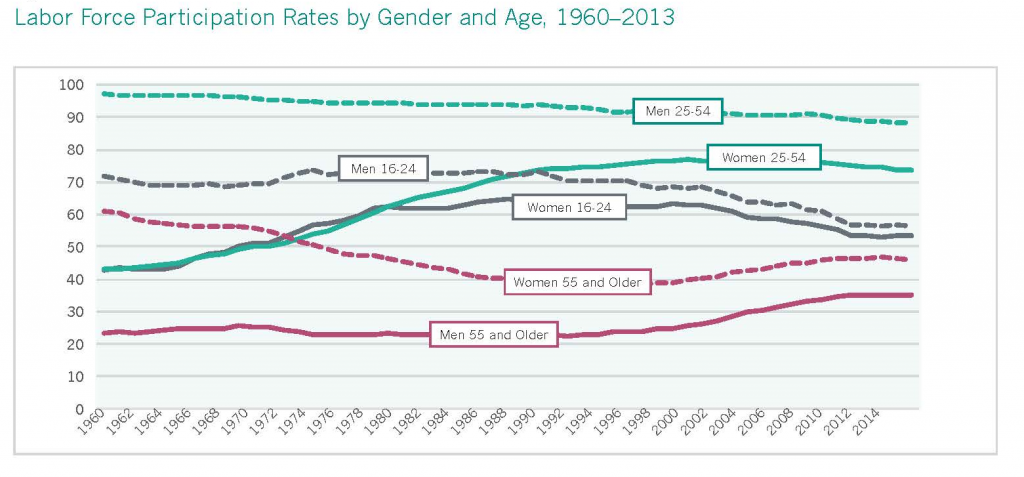
Women’s status in the area of employment and earnings has improved on two indicators since the publication of IWPR’s last national report on the status of women, the 2004 Status of Women in the States, and remained unchanged or declined on two others. Women’s median annual earnings for full-time, year-round work in 2013 ($39,157) were nearly identical to their earnings for similar work in 2002 ($39,108 when adjusted to 2013 dollars). The gender earnings ratio improved during this time from 76.6 to 78.3 percent, narrowing the gender wage gap by 1.7 percentage points, and the share of women working in professional or managerial occupations grew from 33.2 to 39.9 percent. Women’s labor force participation rate, however, declined from 59.6 in 2002 to 57.0 percent in 2014.

View All State Rankings See Key Indicators
Best Worst
1. District of Columbia 51. Mississippi
2. Maryland 50. West Virginia
3. Massachusetts 49. Idaho
4. Connecticut 48. Louisiana
5. New York 47. Alabama
National Overview
Women Men

What Workers Earn

$38,000

$48,000

Gender Wage Ratio

79.2%

Labor Force Participation Rate

58.6%

68.9%

Share of All Workers in Managerial and Professional Jobs

39.9%

33.0%

Note: Aged 16 and older.
Source: IWPR analysis of American Community Survey microdata (Integrated Public Use Microdata Series, Version 5.0).

Earnings and the Gender Wage Gap

During the last thirty years, men’s real earnings in the United States have remained essentially the same, while women’s have grown, albeit from a much smaller base. Between 1980 and 2013, after adjusting for inflation, real median earnings for women’s full-time, year-round work grew nationally from $30,138 to $39,157, while men’s decreased slightly from $50,096 to $50,033. Among women, the growth in real median annual earnings took place in the 1980s and 1990s; since the early 2000s, women’s earnings, like men’s, have stagnated.

Read More See the Data
cummulative losses infographic_cropped
 Median Annual Earnings and the Gender Wage Gap

What Workers Earn by Race/Ethnicity

 Women

Men

White

$40,000

$52,000

Hispanic

$28,000

$30,900

Black

$34,000

$37,500

Asian/Pacific Islander

$46,000

$59,000

Native American

$31,000

$37,000

Other Race or Two or More Races

$38,000

$45,000

Total

$38,000

$48,000

What Workers Earn by Race/Ethnicity Compared with White Men

Women

Men

White

76.9%

Hispanic

53.8%

59.4%

Black

65.4%

72.1%

Asian/Pacific Islander

88.5%

113.5%

Native American

59.6%

71.2%

Other Race or Two or More Races

73.1%

86.5%

Total

73.1%

92.3%

What Workers Earn by Education Level

 Women

Men

Less Than High School Diploma

$21,100

$28,600

High School Diploma or Equivalent

$30,000

$40,000

Some College Education

$34,800

$46,000

Associate’s Degree

$40,000

$50,000

Bachelor’s Degree

$50,000

$70,000

Graduate Degree

$65,000

$94,000

Total

$40,000

$50,000

What College Graduates Earn

$55,000

$76,000

What Workers Earn by Disability Status

 Women

Men

With a disability

$32,500

$42,000

Without a disability

$38,000

$48,000

Change in Median Annual Earnings, 1999–2013

5.4%

-0.7%

Notes: Earnings data are for full-time, year-round workers. Data are for those aged 16 and older, except for data by education level, which are for those aged 25 years and older. Racial groups are non-Hispanic; Hispanics may be of any race or two or more races. A person with a disability is someone who has one or more conditions requiring Assistance with Daily Living (ADL); these may include cognitive, ambulatory, independent living or self-care, vision, or hearing difficulty.
Source: IWPR analysis of American Community Survey data (Integrated Public Use Microdata Series, Version 5.0). For the change in median annual earnings, IWPR analysis of 2000 Decennial Census (for calendar year 1999) and 2013 American Community Survey microdata (Integrated Public Use Microdata Series, Version 5.0).

Women’s Labor Force Participation

Women’s increased labor force participation represents a significant change in the U.S. economy since 1950. As of 2014, nearly six in ten women aged 16 and older (57.0 percent) worked outside the home, compared with 33.9 percent in 1950 and 43.3 percent in 1970. Women now comprise nearly half of the U.S. labor force at 46.8 percent. In each state, however, women are still less likely to be in the workforce than men.

Read More See the Data
labor force participation
Labor Force Participation, Part-Time Work, and Unemployment

Labor Force Participation Rates by Race/Ethnicity

 Women

Men

White

56.7%

69.8%

Hispanic

56.0%

76.1%

Black

59.2%

63.6%

Asian

55.8%

72.4%

Total

57.0%

69.2%

Distribution of Workers by Race/Ethnicity

 Women

Men

White

64.1%

64.9%

Hispanic

14.7%

17.3%

Black

13.2%

10.2%

Asian/Pacific Islander

5.5%

5.3%

Native American

0.6%

0.5%

Other Race or Two or More Races

1.9%

1.8%

Total

75,371,030

84,217,865

Share of All Workers Employed Part-time

29.4%

15.8%

Unemployment Rate by Race/Ethnicity

 Women

Men

White

5.2%

5.4%

Hispanic

8.2%

6.8%

Black

10.5%

12.2%

Asian

4.6%

5.3%

Total

6.1%

6.3%

Unemployment Rate for Parents by Marital Status

 Women

Men

Married, Spouse Present, with Own Children Under 18 Years

4.8%

4.1%

Single Parent with Own Children Under 18 Years

12.0%

10.5%

Unemployment Rate by Disability Status

 Women

Men

With a disability

13.5%

13.0%

Without a disability

6.8%

7.4%

Notes: Aged 16 and older. Bureau of Labor Statistics data include the civilian, noninstitutionalized population aged 16 and older. The BLS data do not include Pacific Islanders in the Asian category and classify Hispanics in the racial groups with which they identify, as well as separately. For IWPR data analysis, racial groups are non-Hispanic; Hispanics may be of any race or two or more races. Part-time includes those who usually work fewer than 35 hours per week. Single parents include those who are never married, married with an absent spouse, divorced, separated, or widowed. A person with a disability is someone who has one or more conditions requiring Assistance with Daily Living (ADL); these may include cognitive, ambulatory, independent living or self-care, vision, or hearing difficulty.
Source: Distribution of workers is IWPR analysis of American Community Survey microdata (Integrated Public Use Microdata Series, Version 5.0). All other data are from the U.S. Bureau of Labor Statistics.

Gender Differences Across Occupations

In the United States, gender differences persist across sectors of employment. An industry sector encompasses all employees of a firm or organization, whether they work as a janitor, secretary, accountant, or information technology specialist. Employment in services such as health care, nongovernmental education, leisure, and other services account for more than four in ten women’s jobs (nationally 43.2 percent), but only one in four men’s jobs (24.8 percent; Table 2.4). The construction industry (1.3 percent of women and 11.1 percent of men), manufacturing (6.6 percent of women and 14.4 percent of men), and transportation and communications (3.0 percent of women and 7.8 percent of men) together account for the jobs held by only one in nine employed women but almost one-third of those held by employed men (Table 2.4).

Read More See the Data
NNU 1 - credit NNU - no restric_Doris_5006 with photo credit


Industry, Occupation, and Employment Sector
Distribution of Workers by Industry  Women Men
Agriculture, Forestry, and Fisheries 1.0% 3.4%
Mining and Construction 1.3% 11.1%
Manufacturing 6.6% 14.4%
Transportation, Communications, and Utilities 3.0% 7.8%
Wholesale and Retail Trade 20.7% 20.5%
Finance, Insurance, and Real Estate 7.3% 5.2%
Services 43.2% 24.8%
Government 16.9% 12.8%
Total 69,232,798 76,991,292
Distribution of Workers by Occupation  Women Men
Management, Business, and Financial 13.7% 15.5%
Professional and Related 26.3% 17.7%
Service 21.8% 15.2%
Sales and Related 11.4% 10.3%
Office and Administrative Support 20.3% 7.0%
Natural Resources, Construction, and Maintenance 0.9% 16.3%
Production, Transportation, and Material Moving 5.7% 18.0%
Total 69,165,921 76,522,319
Share of All Workers in Managerial or Professional Jobs by Race/Ethnicity  Women Men
White 43.7% 37.4%
Hispanic 24.5% 15.8%
Black 32.8% 22.9%
Asian/Pacific Islander 47.2% 50.1%
Native American 32.6% 21.9%
Other Race or Two or More Races 37.8% 33.1%
Total 39.7% 32.9%
Share of All Workers in STEM Fields 4.6% 10.3%
Women’s Share of STEM Workers 28.8% 71.2%
Distribution of Workers by Type of Employment  Women Men
Private Sector 65.0% 70.5%
Self-Employed 7.0% 11.3%
Nonprofit Sector 11.1% 5.3%
Federal Government 2.5% 3.9%
State Government 5.9% 3.6%
Local Government 8.4% 5.3%
All Workers 69,107,828 76,874,871
Notes: Aged 16 and older. All public sector workers are included in government; other sectors are private sector only; services includes health care, education, business and repair services, personal services, entertainment and recreation services, and professional and related services. Racial groups are non-Hispanic; Hispanics may be of any race or two or more races. This definition of STEM occupation follows the U.S. Bureau of Labor Statistics definition of STEM occupations, which includes the social sciences and managerial occupations in social science fieds, but excludes support occupations, health occupations, and most technical and trade occupations that do not require a four-year degree. A person with a disability is someone who has one or more conditions requiring Assistance with Daily Living (ADL); these may include cognitive, ambulatory, independent living or self-care, vision, or hearing difficulty.
Source: IWPR analysis of American Community Survey microdata (Integrated Public Use Microdata Series, Version 5.0).

View Additional Data by State

View additional tables with state-level data on the indicators discussed in this section. State-level data are available for women’s and men’s earnings,  the gender wage gap, the year the wage gap is projected to close, changes in earnings since 1999, labor force participation (rates, part-time, and unemployment), and distribution of workers by industry and by occupation (including those in managerial and professional occupations, and STEM workers). Much of the data is also disaggregated by race and ethnicity.

View the Additional Data by State
iv nurse training

Back to Top

Download the Data

State-level data for women and men are available for the year the gender wage gap is projected to close, median annual earnings, the gender wage ratio, change in real median earnings from 1999-2013, earnings by race and ethnicity, earnings for those with a bachelor’s degree or higher, and share of the lowest and highest earnings quartiles. National data are available for earnings by educational attainment and disability status. State-level data about employment includes labor force participation rates for women and men by race and ethnicity, part-time workers, distribution by major industries and occupations, percent of workers in managerial or professional occupation by race and ethnicity, as well as those working in STEM. National data are available for distribution by occupation by race and ethnicity, types of employment (e.g. private sector, government), and unemployment by race and ethnicity, marital status of parents, and disability.