In This Section
The Political Participation Composite Score
Trends in Women’s Political Participation
Voter Registration and Turnout
The Women in Elected Office Index
- Trends in Women’s Share of Elected Officials
- How the States Compare: Women in Elected Office
- Women in the U.S. Congress
- Women in State Legislatures
- Women in Statewide Elected Executive Office
- Women of Color in Elected Office
- Barriers to Political Office for Women
- Campaigning-While-Female
Women’s Institutional Resources
Labor Unions and Women’s Leadership
Introduction
The equal participation of women in politics and government is integral to building strong communities and a vibrant democracy in which women and men can thrive. By voting, running for office, and engaging in civil society as leaders and activists, women shape laws, policies, and decision-making in ways that reflect their interests and needs, as well as those of their families and communities.
Public opinion polling shows that women express different political preferences from men, even in the context of the recent recession and recovery, when the economy and jobs topped the list of priorities for both women and men. A poll conducted by the Pew Research Center (2012) found that women express concern about issues such as education, health care, birth control, abortion, the environment, and Medicare at higher rates than men. Women’s engagement in the political process—both voting and running for office—is essential to ensuring that these issues are addressed in ways that reflect their needs. Research indicates that women in elected office make the concerns of women, children, and families integral to their policy agendas (Center for American Women and Politics n.d.; Swers 2002 and 2013).
Today, women constitute a powerful force in the electorate and inform policymaking at all levels of government. Yet, women continue to be underrepresented in governments across the nation and face barriers that often make it difficult for them to exercise political power and assume leadership positions in the public sphere. This chapter presents data on several aspects of women’s involvement in the political process in the United States: voter registration and turnout, female state and federal elected and appointed representation, and state-based institutional resources for women. It examines how women fare on these indicators of women’s status, the progress women have made and where it has stalled, and how racial and ethnic disparities compound gender disparities in specific forms of political participation.
| Best and Worst States on Women’s Political Participation | |||||
State |
Rank |
Grade |
State |
Rank |
Grade |
New Hampshire |
1 |
B+ |
Utah |
50 |
F |
Minnesota |
2 |
B |
Texas |
49 |
F |
Maine |
3 |
B |
West Virginia |
48 |
F |
Washington |
4 |
B |
Arkansas |
47 |
F |
Massachusetts |
5 |
B- |
Louisiana |
46 |
D- |
The Political Participation Composite Score
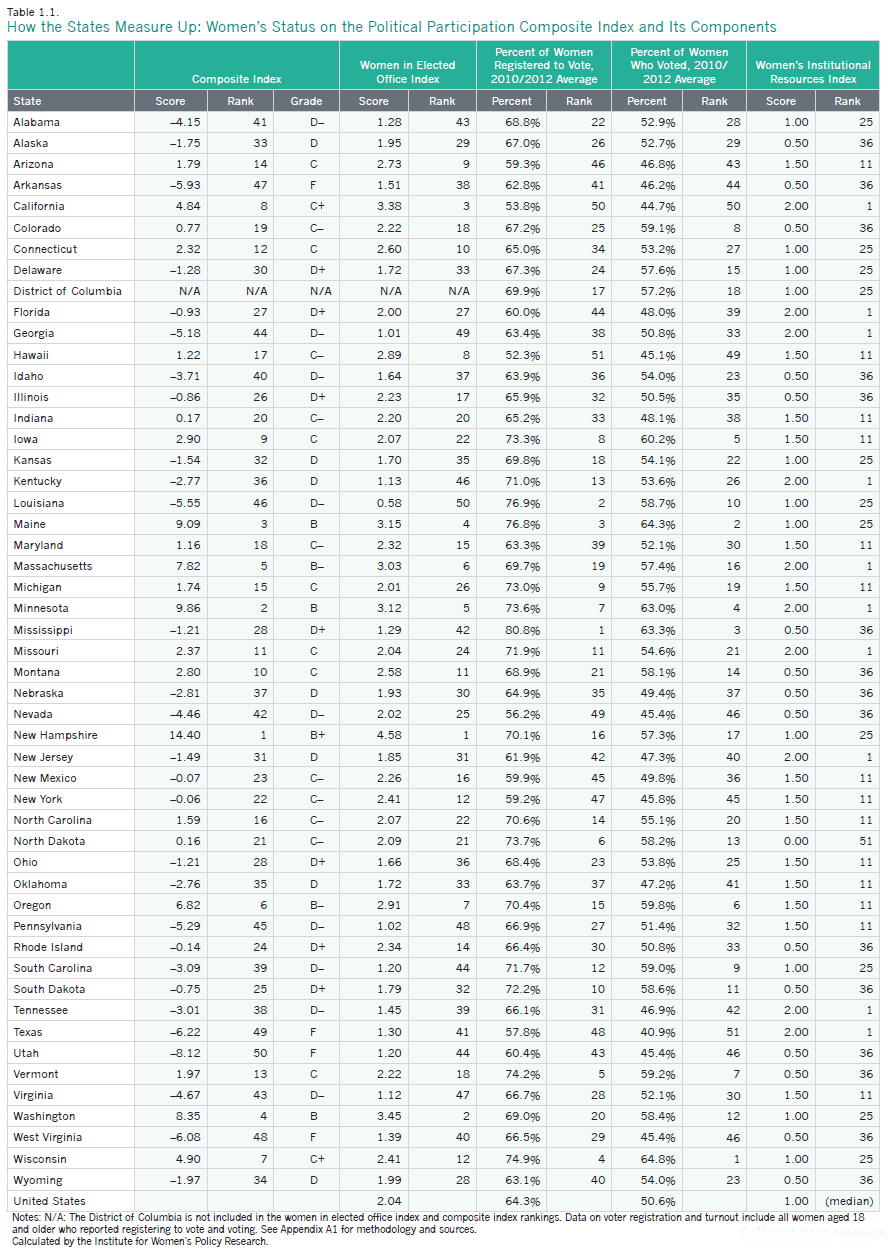
The Political Participation Composite Index combines four component indicators of women’s political status: voter registration, voter turnout, representation in elected office, and women’s institutional resources. Across the 50 states, composite scores range from a high of 14.40 to a low of -8.12 (Table 1.1), with the higher scores reflecting a stronger performance in this area of women’s status and receiving higher letter grades.
- New Hampshire has the highest score for women’s overall levels of political participation (Table 1.1). It ranks in the top one-third for women’s voter registration and voter turnout and is first in the nation for women in elected office, with a score that is approximately one-third higher than that of the second-ranking state, Washington.1
- Utah has the lowest levels of women’s political participation. The state ranks in the bottom ten for women’s voter registration, women’s voter turnout, and women in elected office, and is 36th for the number of institutional resources in the state.
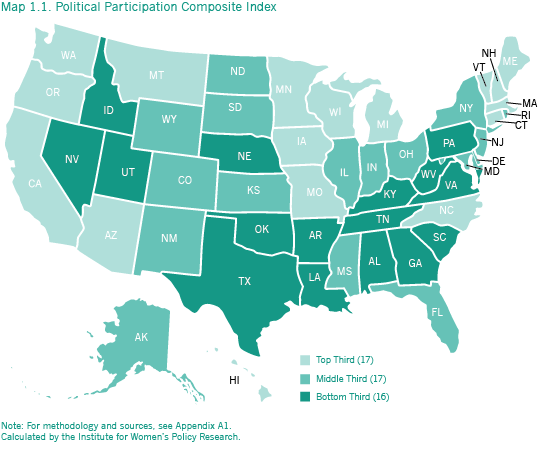
- Women’s political participation is highest overall in New England (with New Hampshire, Maine, and Massachusetts all in the top ten states), the Midwest (with Minnesota, Wisconsin, and Iowa ranking in the top ten), and the Pacific West (with California, Oregon, and Washington also among the ten best ranking states). Montana also ranks in the best ten.
- Women’s political participation is lowest overall in the South (see Map 1.1). Alabama, Arkansas, Georgia, Louisiana, Texas, Virginia, and West Virginia all rank in the bottom ten. Nevada and Pennsylvania are also a part of this group, along with the worst-ranking state, Utah.
- The highest grade on the Political Participation Composite Index is a B+ (Table 1.1), which was given to one state, New Hampshire. This grade reflects the state’s comparatively high levels of women’s political participation, but it also points to the need for improvement in this area of women’s status. Arkansas, Texas, Utah, and West Virginia all received a grade of F. For information on how grades are determined, see Appendix A1.
Trends in Women’s Political Participation
Between 2004 and 2015, the number and share of women in state legislatures and in the U.S. Senate and House of Representatives increased, while the number and share of women in statewide elective executive office declined (CAWP 2015a; IWPR 2004). Women’s voter registration and turnout also showed signs of both progress and lack of progress: the percentage of women who registered to vote was lower in the 2010/2012 elections than in the 1998/2000 elections, but the percentage of women who went to the polls increased during this period (Table 1.1; IWPR 2004).
In 2015, 20 of 100 members of the U.S. Senate (20 percent) and 84 of 435 members of the U.S. House of Representatives (19.3 percent) are women. These numbers represent an increase since 2004, when women held 14 of 100 seats in the U.S. Senate and 60 of 435 seats in the U.S. House of Representatives (CAWP 2015a; IWPR 2004). Still, even though at an all-time high for the U.S. Congress, the share of seats held by women in the U.S. Congress is well below women’s share of the overall population.
- IWPR has calculated that at the rate of progress since 1960, women will not achieve 50 percent of seats in the U.S. Congress until 2117 (IWPR 2015a).
- Women held 1,786 of 7,383 seats in state legislatures across the country in 2015 (24.2 percent), compared with 1,659 of 7,382 seats (22.5 percent) in 2004 (CAWP 2015a; IWPR 2004).
- The number of women in statewide elective executive office declined from 81 (out of 315) in 2004 to 78 (out of 317) in 2015 (CAWP 2004a; CAWP 2015b).2
- In the 1998 and 2000 elections combined, 64.6 percent of women aged 18 and older registered to vote and 49.3 percent voted. In the 2010 and 2012 elections combined, 64.3 percent of women registered to vote, and 50.6 percent went to the polls (Table 1.1; IWPR 2004).
Voter Registration and Turnout
Voting is a critical way for women to express their concerns and ensure that their priorities are fully taken into account in public policy debates and decisions. By voting, women help to choose leaders who represent their interests and concerns. Although women in the United States were denied the right to vote until 1920 and in the following decades were often not considered serious political actors (Carroll and Zerrili 1993), women today have a significant voice in deciding the outcomes of U.S. political elections. In the nation as a whole, women make up a majority of registered voters and have voted since 1980 at higher rates in presidential elections than men (Center for American Women and Politics 2015c).
Women’s stronger voter turnout relative to men’s in the United States reflects an ongoing worldwide struggle to increase women’s political participation. National-level efforts to expand opportunities for women to engage in political processes, and the international movement for women’s rights, have helped to make the inclusion of women in the electorate acceptable in countries around the world. Although women’s political participation varies among nations, women today vote in all countries with legislatures except Saudi Arabia, sometimes at higher rates than men (Paxton, Kunovich, and Hughes 2007).
In the United States, women are considerably more likely to be registered to vote and to go to the polls than men. Nationally, 61.5 percent of women were registered to vote in the 2010 midterm election and 42.7 percent voted, compared with 57.9 percent of men who registered to vote and 40.9 percent who cast a ballot (U.S. Department of Commerce 2011). In the 2012 general election, 67.0 percent of women were registered to vote and 58.5 percent voted, compared with 63.1 percent and 54.4 percent of men (U.S. Department of Commerce 2013). Registration and turnout are higher for both women and men in presidential election years than in midterm election years, when, in terms of national office, only members of Congress are elected.
Women’s voting rates vary across the largest racial and ethnic groups. In 2012, black and non-Hispanic white women had the highest voting rates among the total female population aged 18 and older, at 66.1 percent and 64.5 percent, respectively (U.S. Department of Commerce 2013). Their voting rates were approximately twice as high as the rates for Hispanic women (33.9 percent) and Asian women (32.0 percent; published rates from the U.S. Census Bureau are not available for Native American women).3 The higher voting rate among black women compared with non-Hispanic white women reflects a shift that first occurred in the 2008 elections, differing from the voting patterns of the elections up to 2004, when a larger share of white women had voted compared with any other group of women (U.S. Department of Commerce N.d.). Th is change likely stems from the participation of the nation’s first African American candidate in the presidential election (Philpot, Shaw, and McGowen 2009).
Nationwide, voting rates also vary considerably among women of different ages. Young women have a much lower voting rate than older women. In the 2012 election, 41.3 percent of women aged 18–24 voted, compared with 58.5 percent of adult women overall. Women aged 65–74 had the highest voting rate in 2012 at 70.1 percent, followed by women aged 75 years and older (65.6 percent), women aged 45–64 years (65.0 percent), and women aged 25–44 years (52.6 percent;
U.S. Department of Commerce 2013). Overall, 81.7 million women reported having registered to vote in 2012 and 71.4 million voted, compared with approximately 71.5 million men who said they had registered to vote and 61.6 million who cast a ballot (U.S. Department of Commerce 2013).
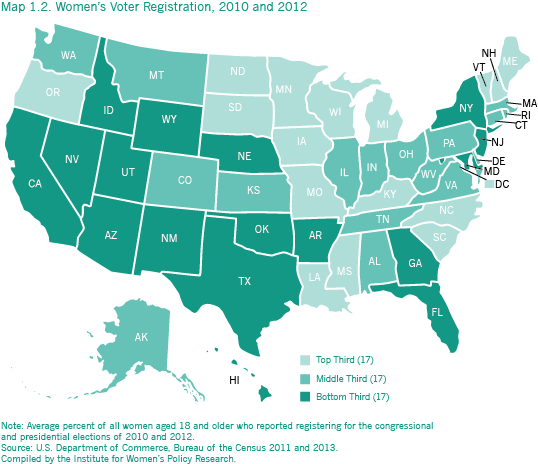
Women’s voter registration rates vary across states (Map 1.2).
- Mississippi and Louisiana had the highest voter registration rates for women in 2010 and 2012 combined at 80.8 percent and 76.9 percent, respectively. Six states in the Midwest—Iowa, Michigan, Minnesota, North Dakota, South Dakota, and Wisconsin—and two states in the Northeast (Maine and Vermont) were also in the top ten (Table 1.2).4
- Women’s voter registration is lowest overall in the western part of the United States. Hawaii had the lowest reported women’s voter registration rate in 2010/2012 at 52.3 percent, followed by California (53.8 percent) and Nevada (56.2 percent). Texas, Arizona, New Mexico, and Utah also rank in the bottom ten. They are joined by two Mid-Atlantic states—New Jersey and New York—and one Southern state (Florida; Table 1.1).
- In 2010, women were more likely to be registered to vote than men in all but three states: Alaska, Montana, and New Hampshire. Th e state with the greatest gender gap in voter registration was Mississippi, where women’s voter registration exceeded men’s by 9.5 percentage points (U.S. Department of Commerce 2011). In 2012, the same general pattern held true: a higher percentage of women were registered to vote than men in all but two states, Arizona and North Dakota. South Carolina had the largest gender gap in voter registration in this year, with a rate for women that was 8.4 percentage points higher than the rate for men (Table 1.1; U.S. Department of Commerce 2013).
- In 26 states, women’s voter registration increased between the 1998/2000 elections and the 2010/2012 elections, while in 24 states and the District of Columbia women’s voter registration decreased. The states with the largest increases in women’s voter registration were Mississippi (6.0 percentage points) and Arizona (5.1 percentage points). The states with the greatest decreases were North Dakota and Minnesota (17.4 and 7.4 percentage points, respectively; Table 1.1 and IWPR 2004).
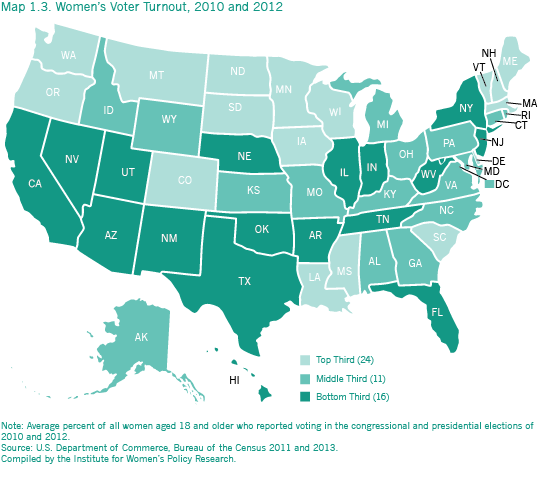
Women’s voter turnout also varies among the states.
- Wisconsin had the highest women’s voter turnout in the country in 2010/2012 at 64.8 percent, followed by Maine (64.3 percent) and Mississippi (63.3 percent). Other states that ranked in the top ten were geographically diverse: Colorado, Iowa, Louisiana, Minnesota, Oregon, South Carolina, and Vermont (Table 1.1; Map 1.3).
- Women’s voter turnout was lowest in Texas in 2010/2012, where only 40.9 percent of women reported voting. Voter turnout in Texas was substantially lower than in the second and third worst states, California (44.7 percent) and Hawaii (45.1 percent). Other states that ranked among the bottom ten for women’s voter turnout include Arkansas, Arizona, Nevada, New York, Tennessee, Utah, and West Virginia (Table 1.1).
- Women’s voter turnout was higher than men’s in the District of Columbia and 39 states in 2010. Among jurisdictions where women’s voter turnout exceeded men’s, the greatest differences were in Mississippi (7.6 points) and the District of Columbia (6.1 points). In 2012, women’s voter turnout was higher than men’s in all but two states, Arizona and North Dakota (the same two states where women’s voter registration was also lower than men’s in this year). The largest differences in voter turnout rates were in South Carolina and Louisiana, where women’s turnout was higher than men’s by 10.6 and 9.0 percentage points, respectively (Table 1.1; U.S. Department of Commerce 2011; U.S. Department of Commerce 2013).
- In 30 states, women’s voter turnout increased between the 1998/2000 elections and the 2010/2012 elections, while in 20 states and the District of Columbia their voter turnout decreased. The states with the largest increases in women’s voter turnout were Mississippi (10.8 percentage points) and North Carolina (8.1 points). The states with the greatest decreases were Alaska (7.8 points) and Wyoming (6.3 points; Table 1.1; IWPR 2004).
The Impact of Voter Identification Laws on Women
Although women constitute a powerful force in the electorate, a new wave of recently passed state
voter identification laws has raised concern that some women (and men) may be prevented from
casting ballots in future elections. The momentum behind voter identification laws in the United
States has increased since the passage of the first “strict” voter identification laws in Georgia and
Indiana in 2005, which required voters to show identification at the polling place at which they vote (other states had previously requested, but not required such identification, starting with South Carolina in 1950; National Conference of State Legislatures 2014a). As of March 2015, a total of 34 states had passed voter identification laws (National Conference of State Legislatures 2014b),
which varied across states in their requirements and degree of “strictness” (Keysar 2012). Some
states require that voters must show government-issued photo identification to vote, while others are more lenient and accept non-photo identification such as a bank statement with name and address (National Conference of State Legislatures 2014b).
Studies focusing on the populations most likely to be affected by voter identification laws indicate
that women, especially low-income, older, minority, and married women, may be particularly affected by stringent voter identification laws (Brennan Center for Justice 2006; Gaskins and Iyer 2012; Sobel 2014). For example, women are more likely to be prevented from voting by laws that require them to show multiple forms of identification with the same name—such as a driver’s license and birth certificate—since women who marry and divorce often change their names. A national survey sponsored by the Brennan Center for Justice in 2006 found that more than half of women with access to a birth certificate did not have one that reflected their current name, and only 66 percent of women with access to any proof of citizenship had documents reflecting their current name (Brennan Center for Justice 2006). The Brennan Center survey showed that 11 percent of the 987 randomly selected citizens of voting age did not have a photo ID. Low-income women (and men) who lack photo identification may face barriers like limited transportation and financial costs associated with accessing other identifying documents like birth certificates and marriage licenses; once time, travel, and the costs of documents are factored in, the cost associated with a “free ID card” can range from $75 to $175; when legal fees are included, the costs can be as high as $1,500 (Sobel 2014). These laws could make acquiring an identification card prohibitively expensive for women, who represent a greater share of those in poverty (IWPR 2015b). Older women may also be affected by voter identification card requirements, since older populations are less likely to have a valid identification card than younger eligible voters (Brennan Center for Social Justice 2006).
The U.S. Government Accountability Office (GAO) conducted a quasi-experimental design to see if
voter ID laws affected turnout in Kansas and Tennessee by comparing the two states to neighboring states and controlling for certain factors. It found that “turnout among eligible and registered voters declined more in Kansas and Tennessee than it declined in comparison states—by an estimated 1.9 to 2.2 percentage points more in Kansas and 2.2 to 3.2 percentage points more in Tennessee— and the results were consistent across the different data sources and voter populations used in the analysis.” It also found that young voters, those who had been registered for less than one year, and African American voters had turnout reduced by larger amounts (U.S. GAO 2014).
Because the laws are new and their impact is difficult to measure, their effects are not yet fully
understood. Recent studies have yielded mixed results; some have found that voter identification
laws have a negative impact on voter turnout (Alvarez, Bailey, and Katz 2007; U.S. GAO 2014), while others have deemed the effects of such laws too minimal to make an impact (Mycoff, Wagner, and Wilson 2009). More research is needed to determine exactly how laws that tighten identification rules for voting may affect women and men differentially.
The Women in Elected Office Index
Trends in Women’s Share of Elected Officials
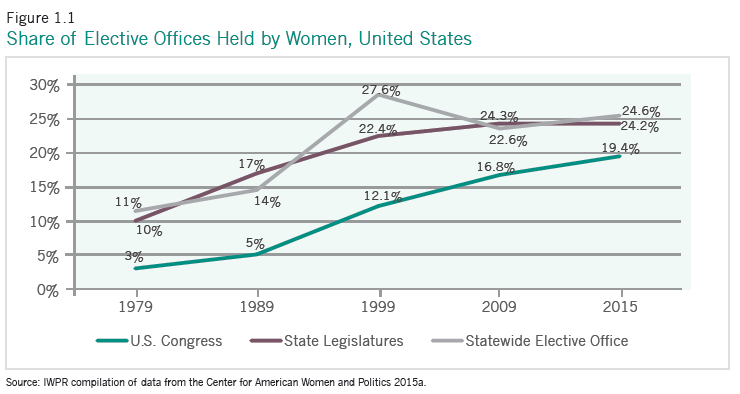
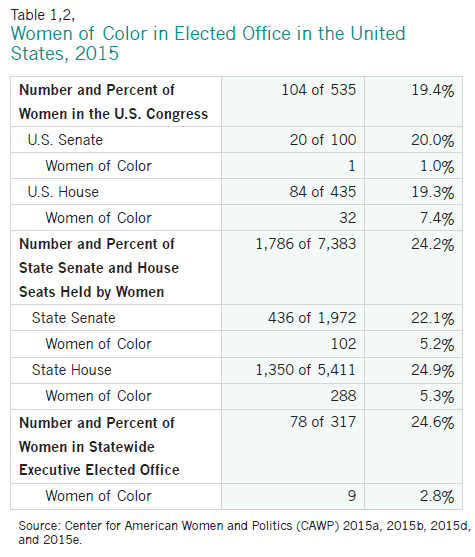
Although women have become increasingly active in U.S. politics, the majority of political office holders at the state and federal levels are still male. As of March 2015, women held just 104 of 535 (19.4 percent) seats in the U.S. Congress, 1,786 of 7,383 (24.2 percent) seats in the nation’s state legislatures, and 78 of 317 (24.6 percent) statewide elective executive offices (Table 1.2). Among women of color, the level of representation is especially low: women of color—who constitute approximately 18 percent of the population aged 18 and older (IWPR 2015b)—hold about 6.2 percent of seats in the U.S. Congress, 5.3 percent of seats in state legislatures, and 2.8 percent of statewide elective executive positions (Table 1.2).5
While these figures reflect substantial advances for women over the last several decades, little progress has been made in recent years. In 1979, women held 3 percent of seats in the U.S. Congress, 10 percent of state legislature seats, and 11 percent of statewide elective executive offices. The percentage of seats in the U.S. Congress held by women is now six times larger, and the percentage of state legislature and statewide elective executive offices held by women has more than doubled; yet, in the six year period between 2009 and 2015, women’s representation in Congress grew only minimally, from 16.8 percent to 19.4 percent. During this same time period, their representation in statewide elective executive offices also barely changed (increasing slightly from 22.6 percent to 24.6 percent), and their representation in state legislatures decreased from 24.3 percent to 24.2 percent (Figure 1.1).
Research suggests that women generally win elected office at similar rates as men (Dolan 2004), but fewer women run for office (Lawless and Fox 2008). Other studies emphasize the barriers women face nearly every step of the way (Baer and Hartmann 2014). Women are less likely than men to decide to run on their own and need to be recruited to run for office (Sanbonmatsu, Carroll, and Walsh 2009; Carroll and Sanbonmatsu 2013), yet women are much less likely than men to be encouraged to run (Lawless and Fox 2010) and to have access to networks of political leaders who could help them get elected (Goetz 2007). For some women, the lack of supportive policies for working families in the United States—such as subsidized child care and paid maternity and caregiving leaves—may be a deterrent to running for elected office. One study that investigated how women make the decision to run for elected office also found that in some cases, women are discouraged by political party leaders, their peers, or other elected officeholders from running for or serving in higher offices (Baer and Hartmann 2014).
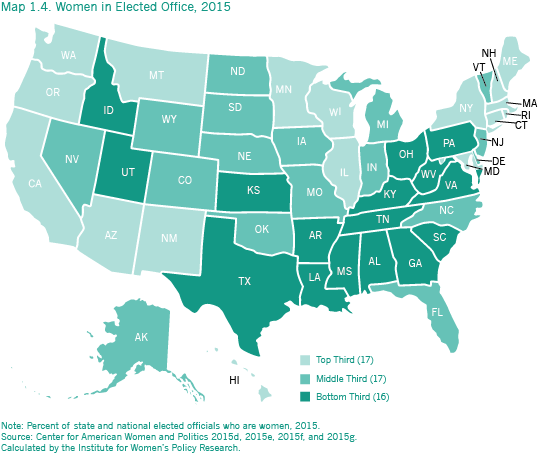
How the States Compare: Women in Elected Office
The Women in Elected Office index measures women’s representation at state and national levels of government: the U.S. Congress, statewide elective offices, and state legislatures.
- New Hampshire has the highest score on the elected office index, followed by Washington and California (Table 1.1).
- Louisiana has the lowest score on the index on women in elected office, followed by Georgia and Pennsylvania.
- The states with the highest scores are in New England and the West. In addition to New Hampshire, three New England states—Connecticut, Maine, and Massachusetts—rank in the top ten. Two western states in addition to California and Washington—Oregon and Hawaii—are also in the best-ranking group. Other states in the top ten include Arizona and Minnesota.
- The states with the worst scores on women in elected office are primarily in the South. In addition to Louisiana and Georgia, six Southern states—Alabama, Kentucky, Mississippi, South Carolina, Texas, and Virginia—are in the bottom ten. Pennsylvania and Utah also rank in the bottom ten for women’s representation in elected office.
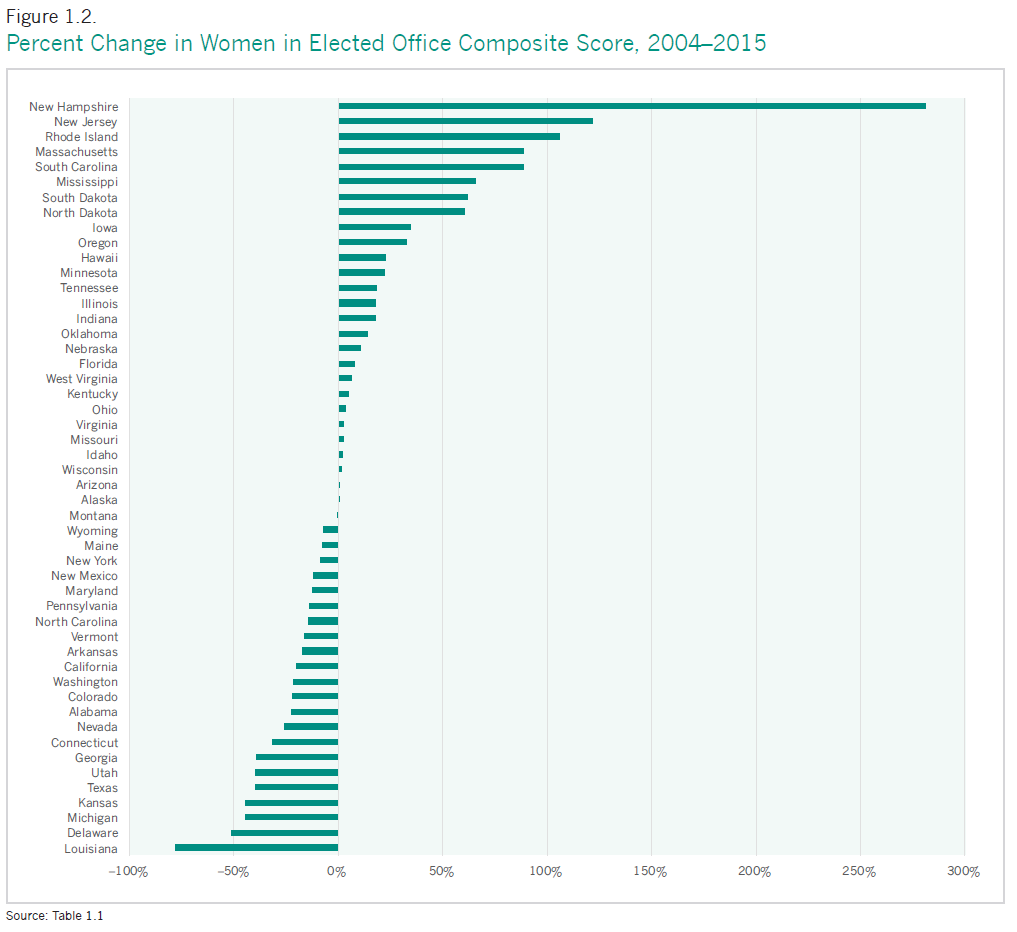
Figure 1.2 demonstrates the percent change in states’ scores in the women in elected office index between 2004 and 2015. Twenty-three states declined in women’s representation, while 27 states improved their score. Among the states that increased their score, New Hampshire (281.6 percent), New Jersey (121.3 percent), and Rhode Island (106.0 percent) all more than doubled their score. Louisiana (-77.7 percent), Delaware (-50.8 percent), and Michigan (-44.4 percent) experienced the largest declines.
New Hampshire’s substantial gains place it first on the women in elected office index (up from 42nd place in 2004). Three of its four Congressional seats (both Senators and one of two representatives) are held by women. It ranks sixth for women in its state senate and is in the top third for women in its lower house. New Hampshire also has a woman governor.
Women in the U.S. Congress
The 19.4 percent of seats (104 of 535) that women hold in the U.S. Congress represents an all-time high (CAWP 2015a). Progress is moving at a snail’s pace, however, and if it continues at the current rate of change since 1960, women will not achieve equal representation in Congress until 2117 (IWPR 2015a).
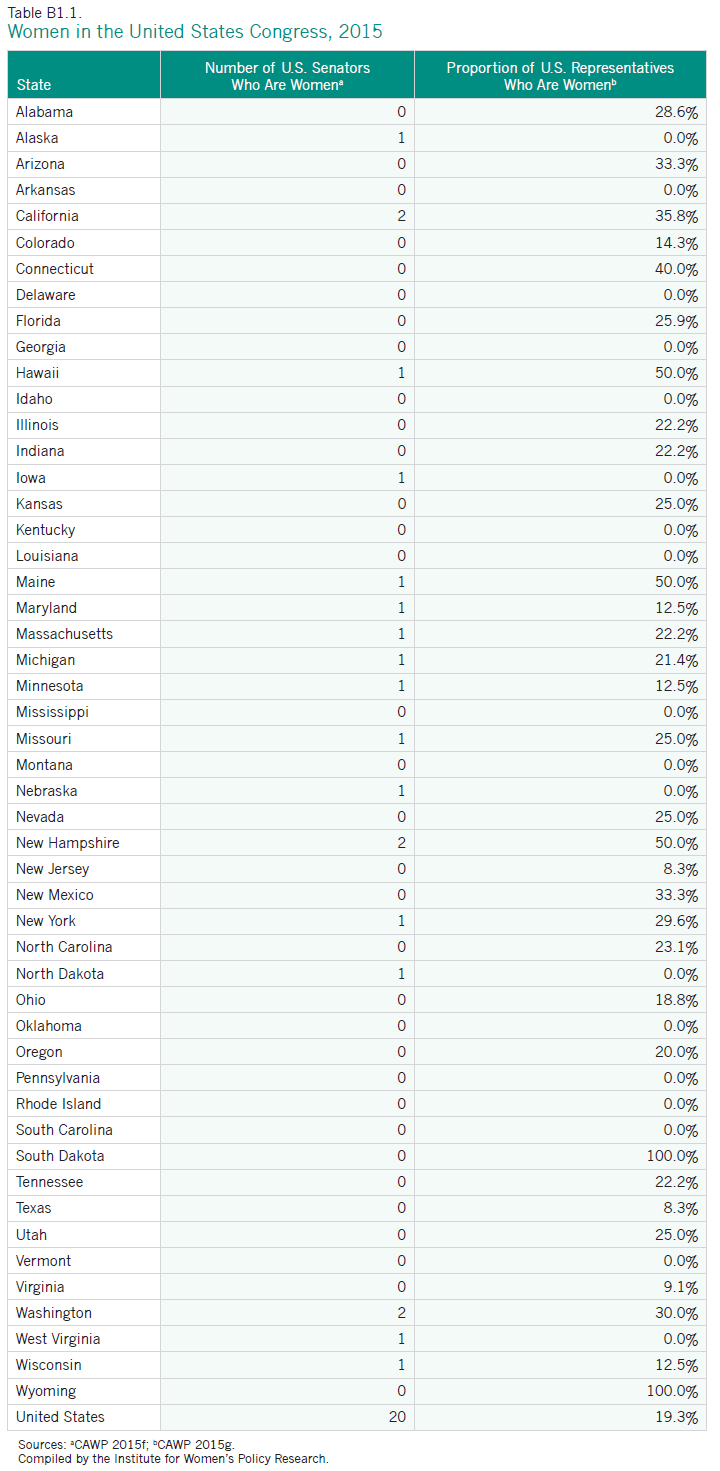
- In five states—Hawaii, Maine, New Hampshire, South Dakota, and Wyoming—women constitute at least half of the state’s representatives to the U.S. House of Representatives. These are all small states: Hawaii, Maine, and New Hampshire each have two seats, and South Dakota and Wyoming each have one seat. Eighteen states have no female representatives (see Appendix B1.1).6
- There are only three states in which both senators are female: California, New Hampshire, and Washington. Thirty-three states have no female senators (Appendix Table B1.1).
- Three states have never sent a woman to either the U.S. House or the Senate: Delaware, Mississippi, and Vermont (CAWP 2015j).
- In 21 states, the share of representatives to the U.S. Congress who were female increased between 2004 and 2015, while in 7 states the share decreased, and in 22 states the share stayed the same (Appendix Table B1.1; IWPR 2004).
- In 10 states, the share of Senators to the U.S. Congress who were female increased between 2004 and 2015, while in 5 states the share decreased, and in 35 states the share stayed the same (Appendix Table B1.1; IWPR 2004).
Women in State Legislatures
Women’s representation in state legislatures is progressing at different speeds in states across the nation. As of 2015, there were no states in which women held half of the seats in either the state senate or the state house or assembly.
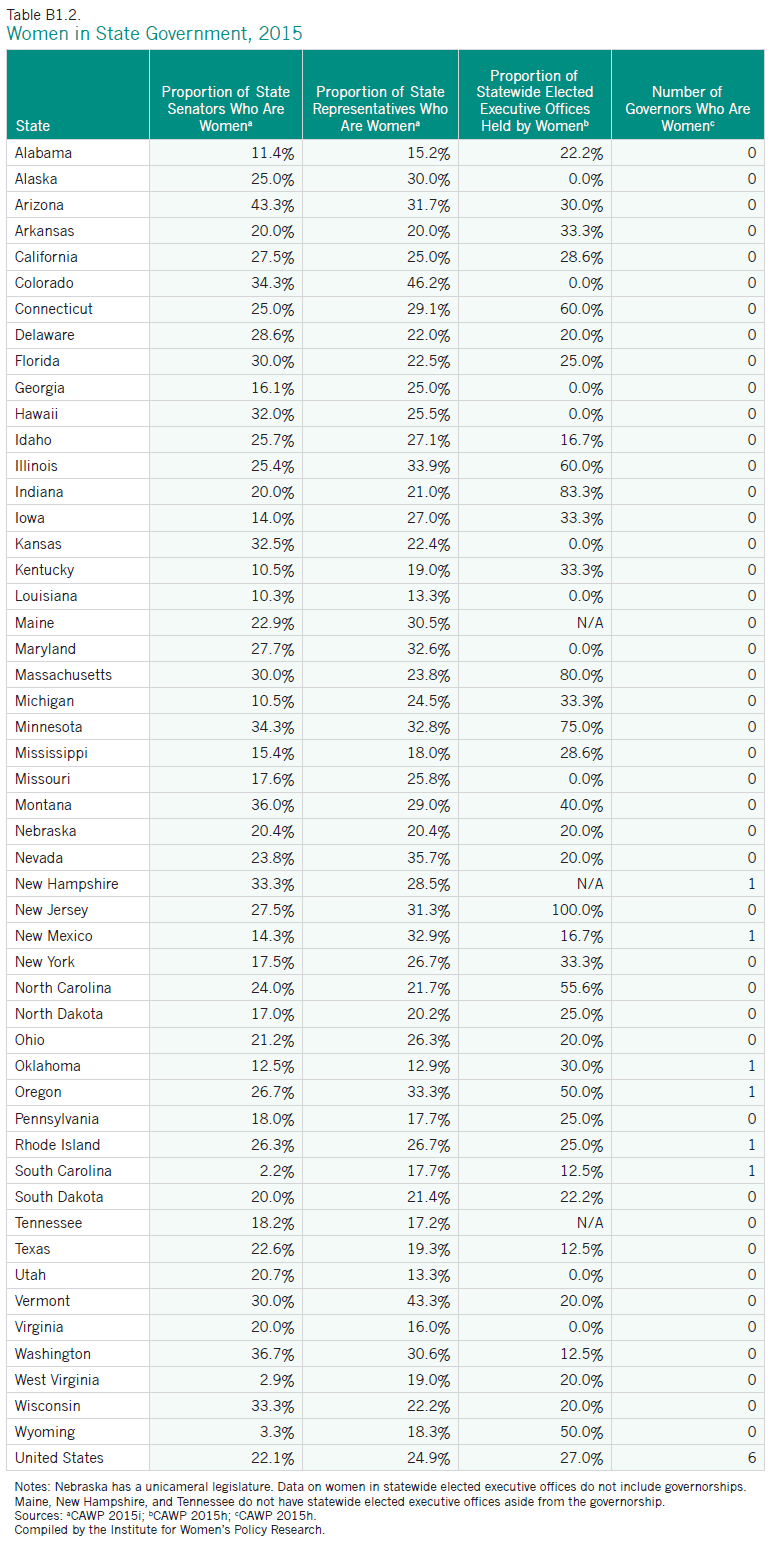
- The share of state senate seats held by women is largest in Arizona (43.3 percent), Washington (36.7 percent), and Montana (36 percent) and smallest in Wyoming (3.3 percent), West Virginia (2.9 percent), and South Carolina (2.2 percent; Appendix Table B1.2).
- The share of seats in the state house or assembly held by women is largest in Colorado (46.2 percent) and Vermont (43.3 percent), and smallest in Louisiana and Utah (13.3 percent each) and in Oklahoma (12.9 percent; Appendix Table B1.2.)
- Between 2004 and 2015, the share of state senate seats held by women increased in 27 states, with the largest gains in Montana, where women’s share of these seats increased from 16.0 to 36.0 percent. Among the 16 states where women’s share of seats decreased, Michigan experienced the greatest decline (from 28.9 percent in 2004 to 10.5 percent in 2015; Appendix Table B.2 and CAWP 2004b).
- Between 2004 and 2015, the share of state house or assembly seats held by women increased in 32 states, with the largest gains in New Jersey, where women’s share of these seats grew from 16.3 percent to 31.3 percent. Among the 17 states that experienced a decline, Utah had the largest decrease (from 22.7 percent to 13.3 percent; Appendix Table B.2 and CAWP 2004b).
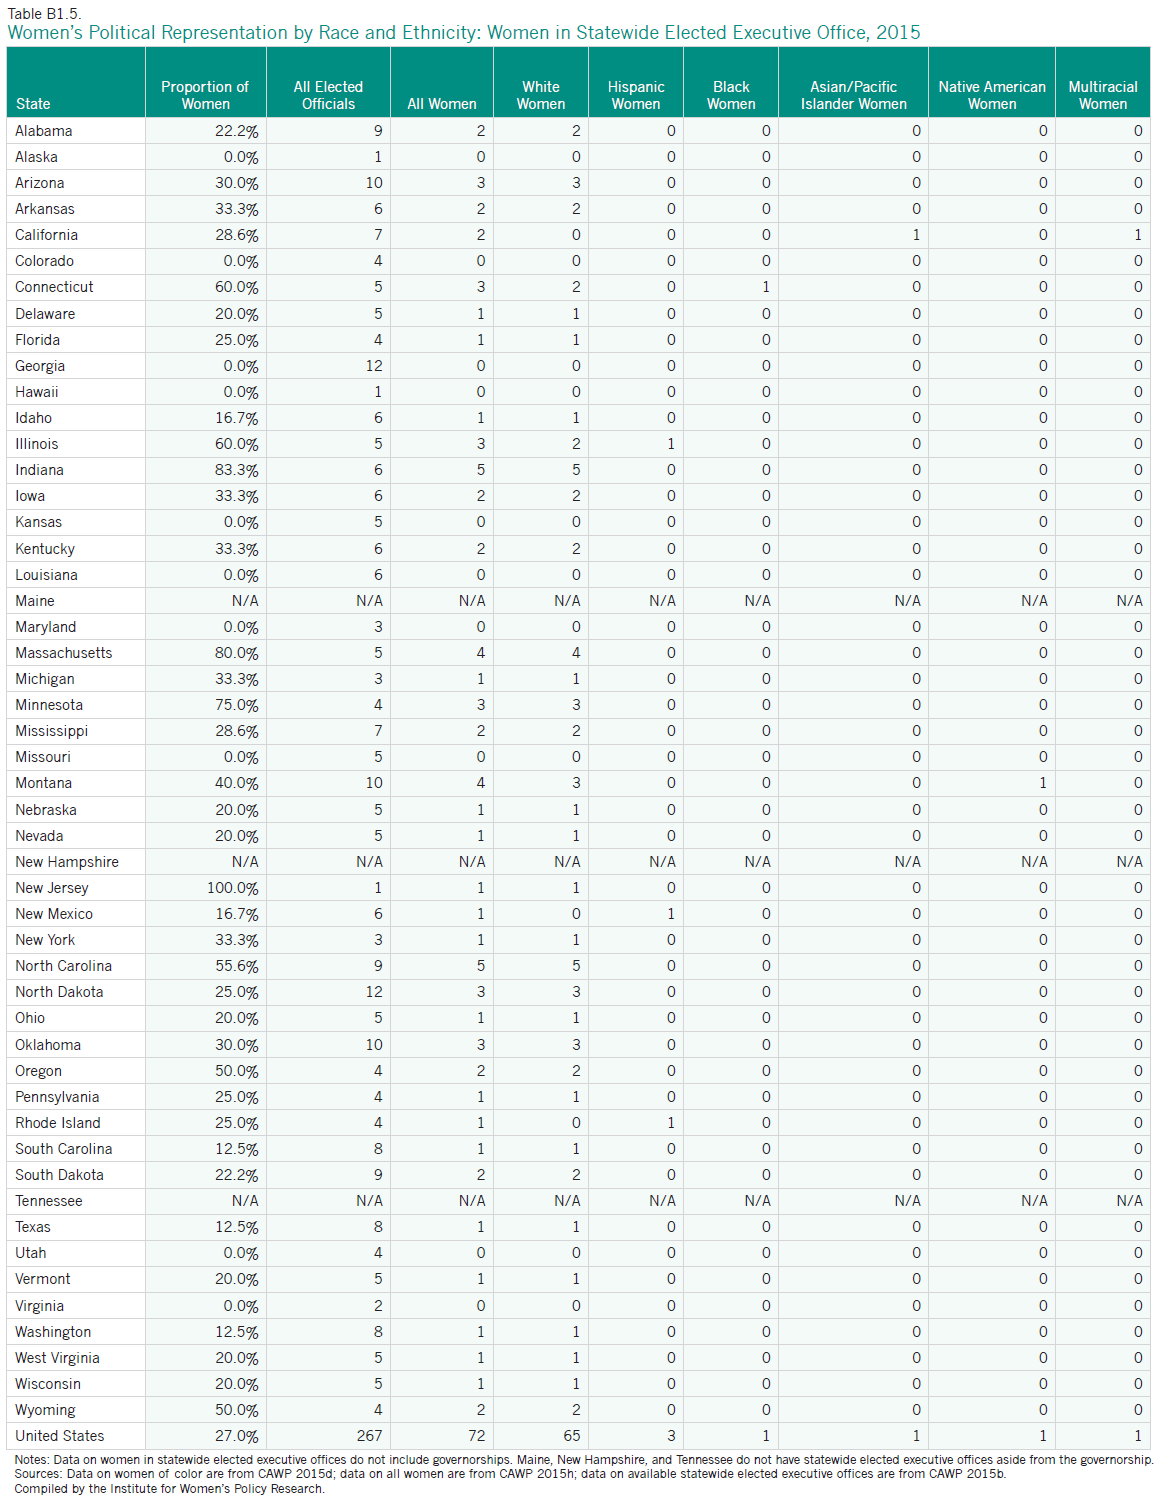
Women in Statewide Elected Executive Office
- As of March 2015, six states had female governors: New Hampshire, New Mexico, Oklahoma, Oregon, Rhode Island, and South Carolina. The largest number of female governors to have served simultaneously is nine, in both 2004 and in 2007. Throughout U.S. history, 36 women have served as governors in 27 states (CAWP 2015k), out of a total of more than 2,300 governors (National Governors Association 2015).
- In nine states, women hold at least half of statewide elected executive office positions aside from governorships. Ten states have no women in their statewide elected executive offices 7 (Appendix Table B1.2).
- Between 2004 and 2015, the share of women in statewide elected executive offices other than governorships increased in 17 states, decreased in 16 states, and stayed the same in 14 states.8
Women of Color in Elected Office
While women of color have made progress in gaining representation, they are still vastly underrepresented at every level of government reviewed here.
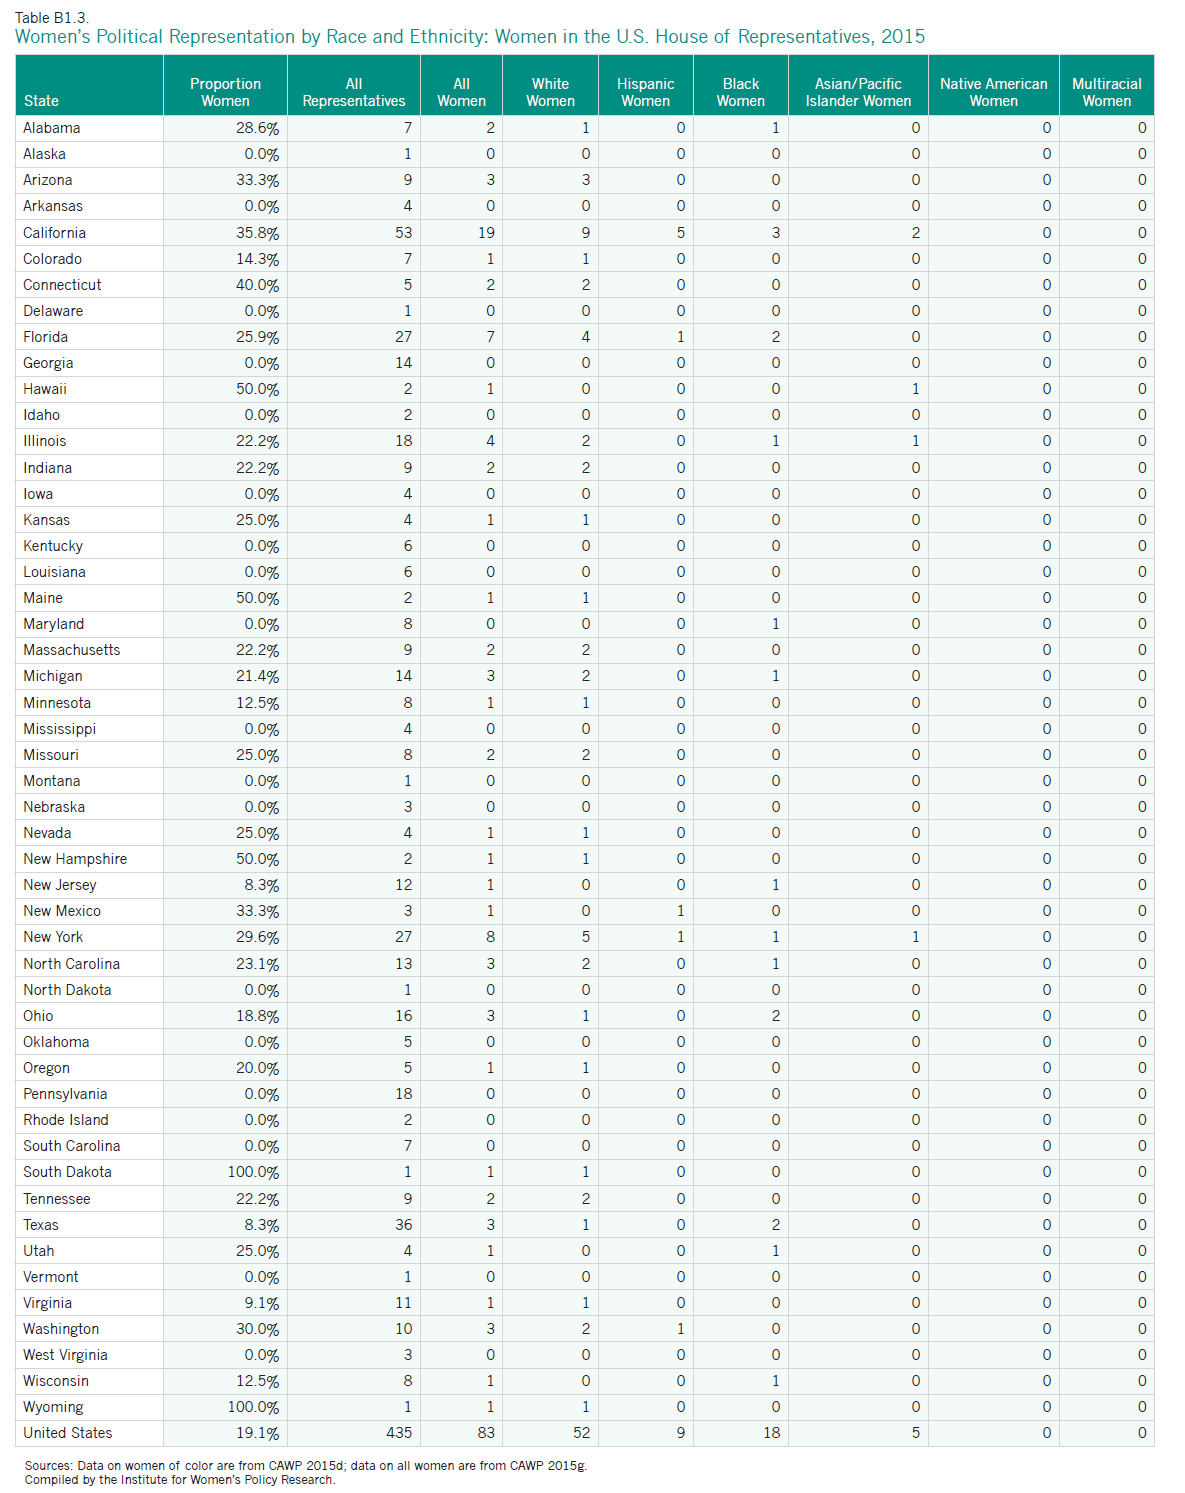
- Women of color make up 7.4 percent (32 of 435 representatives) of the U.S. House of Representatives (Appendix Table B1.3). California has the greatest number of women of color in the House, at 10 of its 53 representatives. Florida and New York, each with 27 members, each have three women of color serving in the House. The states with the greatest proportions of women of color in the House are Hawaii (50.0 percent, or one of two members), New Mexico (33.3 percent, or one of three members), and Utah (25.0 percent, or one of four members). Thirty-four states have no women of color serving as representatives.
- Of the 32 women of color serving in the House of Representatives, 18 are black, nine are Hispanic, and five are Asian/Pacific Islander.
- There is only one woman of color—Senator Mazie Hirono of Hawaii—serving in the U.S. Senate (CAWP 2015d).
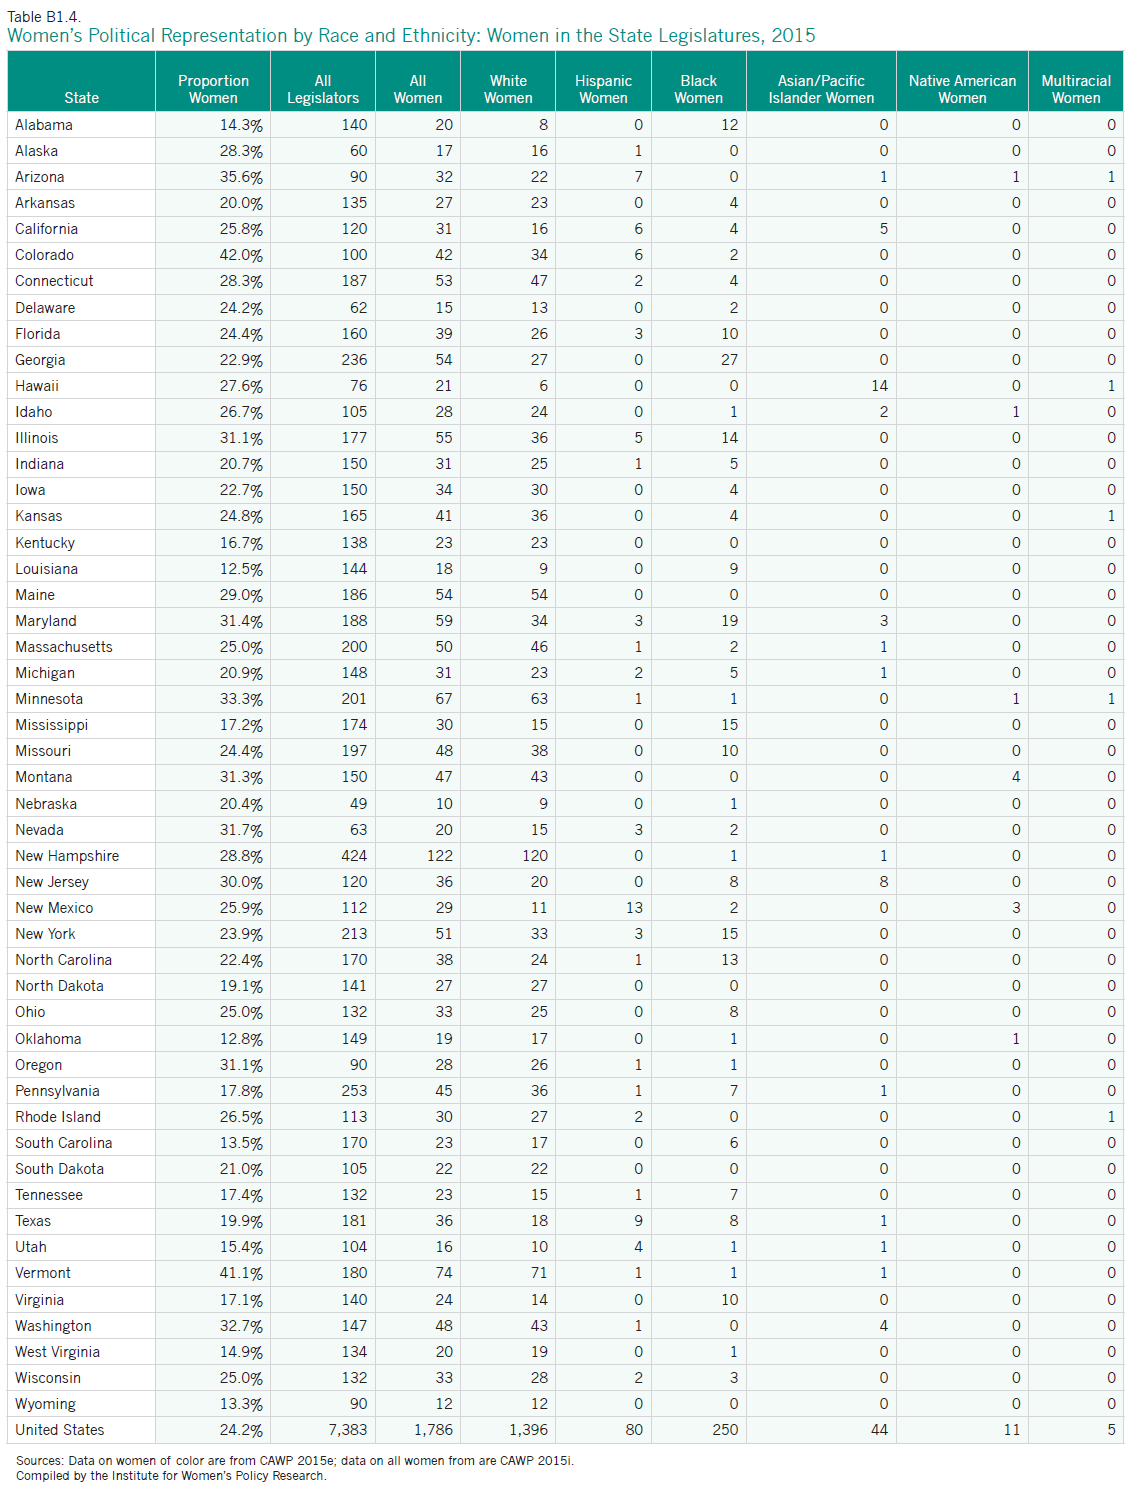
- Women of color are 5.3 percent (390 of 7,383 legislators) of the state legislators in the United States (Appendix Table B1.4). The states with the greatest number of women of color legislators are Maryland (25 of 188 legislators) and Georgia (27 of 236 legislators). The states with the greatest proportions of women of color in state legislatures are Hawaii (15 of 76 legislators, or 19.7 percent), and New Mexico (18 of 112 legislators, or 16.1 percent). Five states— Kentucky, Maine, North Dakota, South Dakota, and Wyoming—have no women of color serving in their state legislatures.
- Of the 390 women of color state legislators, 250 are black, 80 are Hispanic, 44 are Asian/Pacific Islander, 11 are Native American, and five are multiracial.
- There are nine women of color in statewide executive elective office, including two governors (CAWP 2015d). California and New Mexico have the greatest number of women of color in statewide elective office, at two each. Connecticut, Illinois, Montana, Rhode Island, and South Carolina each have one woman of color serving in statewide elective office. Of the nine, four are Hispanic, two are Asian/Pacific islander, one is African American, one is Native American, and one is multiracial.
- Two Governors—Nikki Haley of South Carolina, and Susana Martinez of New Mexico—are women of color (CAWP 2015d). Governor Haley is Indian American and Governor Martinez is Latina.
Barriers to Political Office for Women
Women’s active participation in elective office is critical to ensuring the democratic character of our nation. Still, women are largely underrepresented at every level of office, and progress toward achieving parity has nearly stalled.
In a recent report, Shifting Gears: How Women Navigate the Road to Higher Office (Hunt Alternatives Fund 2014), Political Parity, a program of the Hunt Alternatives Fund, has identified the barriers women face in seeking political office, especially in attempting to move to higher political office (such as governorships and positions in the U.S. Congress). The report uses the analogy of the “driver” and “the road” to describe the debate in the political science field about whether women are holding themselves back because they have less ambition (Lawless and Fox 2012) or whether women are held back by various pot holes and barriers along the road (Baer and Hartmann 2014; Carroll and Sanbonmatsu 2013). It suggests that both the driver and the road are essential to any journey. Women are often seen to perform as well as men when they campaign for office—with similar fund-raising totals and electoral success—yet fewer women decide to pursue candidacy.
One study on the “driver” side attributes the underrepresentation of women in higher office to a gender gap in political ambition (Lawless and Fox 2012). The study analyzed data from a survey of 4,000 male and female potential candidates—those who are well situated to pursue candidacy—and found that 62 percent of men, compared with 46 percent of women had ever considered running for office, and 22 percent of men and 14 percent of women were interested in running for office in the future. On the “road” side, a qualitative study of 60 women candidates who have run for the U.S. Congress or for state and local offices (or have seriously considered running for office) identified barriers women face to running for higher office, and action items for increasing the number of women in elected office. Among the most cited barriers were fundraising, which must be ramped up to a much higher level when running for Congress or a state-wide office—making the ask, developing relationships with donors so that when asked, donors respond, and having access to good call lists—as well as campaigning while female, balancing family obligations and office holding with campaigning, and the dominance of informal, male political networks that often exclude women (Baer and Hartmann 2014).
Proposed action items for increasing the number of female officeholders include recruiting and asking women to run; expanding and enhancing woman-centered campaign training, especially on-going training that emphasizes pursuing politics as a career and making longer run plans for strategically choosing which offices to seek; launching an organized effort to build the pipeline to office and improve strategic race placement; providing for mentoring and sponsorship of women candidates and elected officials; increasing understanding of fundraising, which includes building relationships with sponsors, who may be established office holders or those who do not hold political office but often support candidates they think can be successful; strengthening networks of women’s organizations; raising awareness among the public of female role models and increasing respect for women; and making campaigning and office holding more family-friendly (Political Parity 2014). Many of these strategies require that outside groups, such as a strengthened network of women’s organizations, become more active in supporting women who run for office (Baer and Hartmann 2014; Carroll and Sanbonmatsu 2013).
Following through with these recommendations may make the difference in encouraging more women to run for office and in helping them excel once they get there. Only then will our institutions of government be able to fully elevate women’s perspectives and policy priorities and will the nation be able to benefit from women’s leadership.
Campaigning-While-Female
“Campaigning-while-female” refers to experiences that many women running for elective office believe are different from men’s. Campaigning-while-female highlights experiences that differ from incidents of discrimination. Discrimination is seen in instances where women candidates and elected officials may receive fewer resources such as campaign donations and party financial support, or fewer opportunities to sponsor legislation or participate in influential committees (Baer and Hartmann 2014). Rather, campaigning-while-female refers to a range of inappropriate and sexist comments and behaviors, such as a focus on outward appearance, questioning of qualifications for office, and increased curiosity about a woman’s personal life, such as her role as a wife and mother. While male candidates may also experience unwelcome curiosity about their private lives, women believe these concerns are expressed much more strongly to women candidates, including frequent comments, for single women, on their dating life (Baer and Hartmann 2014). Women candidates and elected officials have expressed the need to be always “on,” to always observe societal norms for how a woman in leadership should act and look. Many have experienced the “double bind” and seek to overcome it—they act like strong leaders but hope to escape the stigma of being labeled an aggressive woman (Political Parity 2014).
Campaigning-while-female is relatively common; one study of women candidates and elective officials found that approximately nine in ten (88 percent) participants said women’s campaign experiences are different from men’s (Baer and Hartmann 2014). The most notorious example of campaigning-while-female came about during the 2008 presidential election, when Democratic candidate Hillary Clinton and Republican Vice Presidential nominee Sarah Palin were often portrayed as the “bitch” and the “ditz” (New York Magazine, 2008). This sexist treatment is most commonly associated with media coverage, but women also receive it from constituents, donors, peers and colleagues, and political party operatives and leaders.
The sexist treatment of women candidates and elected officials may dissuade women from running for political office, or may influence a voter’s likelihood of supporting a female candidate (Lake Research Partners 2010). In one survey of 800 likely voters nationwide, both female and male participants who heard sexist attacks by media on a hypothetical female candidate were less likely to vote for her than the control group that heard a non-sexist attack on the candidate. There was also backlash against the male candidate for issuing sexist attacks; however, the female candidate endured the greatest toll on her favorability and the likelihood that a voter might vote for her. When the female candidate or a surrogate called out the sexist treatment by the media, the support for the female candidate resurged (Lake Research Partners 2010). This finding emphasizes the importance of candidates and supportive networks calling out double standards and unfair treatment not only by the media but also by other candidates (Political Parity 2014).
Women’s Institutional Resources
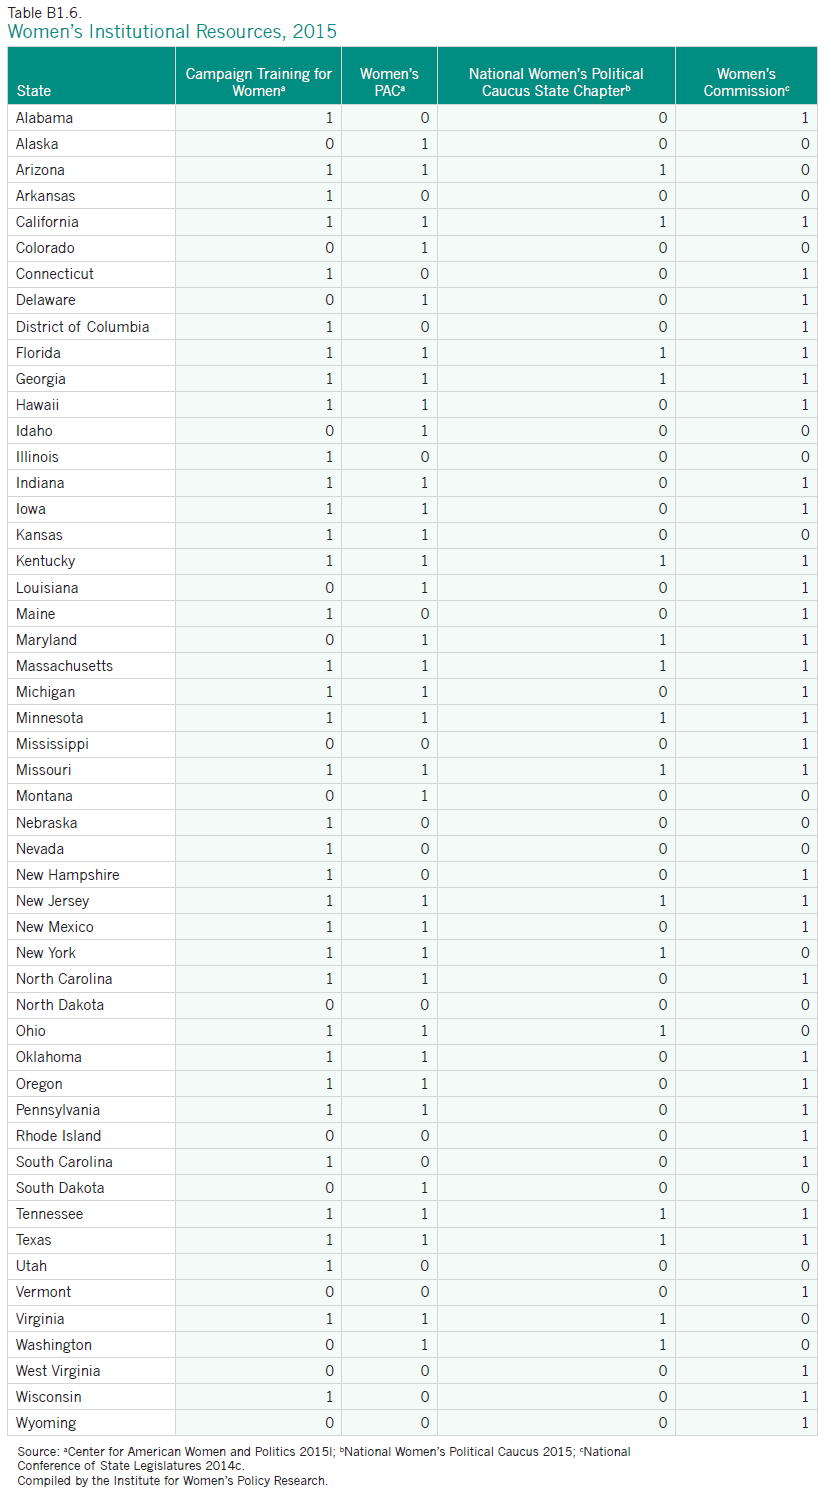
In addition to women’s voting and election to local, state, and federal offices, institutional resources dedicated to helping women succeed in the political arena and to promoting and prioritizing women’s policy issues play a key role in connecting women constituents to policymakers. Such resources include campaign trainings for women, women’s Political Action Committees (PACs), women’s commissions, and state chapters of the National Women’s Political Caucus (NWPC). These institutional resources serve to amplify the voices of women in government and increase the access of women, their families, and their communities to decision makers on the policy issues that matter most to them. Institutional resources and statewide associations also provide peer support systems for female elected officials and establish informal networks that can help them navigate a political system that remains predominantly male (Strimling 1986).
Campaign trainings for women provide valuable insight into running a successful campaign and strengthen the pipeline to higher office. One study found that nine in ten women who participated in a training before running found it extremely helpful; many also believed that campaign trainings should be expanded to be more women-centric so as to address the issue of “campaigning-while-female” (Baer and Hartmann 2014). Experienced women candidates also expressed a need for a range of candidate training, from running for one’s first office to running for a seat in one’s congressional delegation, which as a national office requires the candidate to learn a new range of skills. Most training, however, seems to be aimed at encouraging women to run for their first office.
Political action committees (PACs) raise and spend money for the purpose of electing and defeating candidates. A PAC may give directly to a candidate committee, a national party committee, or another PAC, within the contribution limits (Open Secrets 2015). A women’s PAC may be critical to supplying a female candidate with the campaign contributions she needs to launch a successful campaign. A women’s PAC may also bolster candidates who support women-friendly policy and legislation. In 2014, there were 23 national and 47 state or local PACs or donor networks that either gave money primarily to women candidates or had a primarily female donor base (CAWP 2014).
A commission for women is typically established by legislation or executive order and works to prioritize issues that may disproportionately affect women’s lives (National Conference of State Legislatures 2014c). In many states across the nation, women’s commissions—which can operate at the city, county, or state level—strive to identify inequities in laws, policies, and practices and recommend changes to address them. Women’s commissions may engage in a variety of activities to benefit women in their geographic areas, including, but not limited to, conducting research on issues affecting the lives of women and families, holding briefings to educate the public and legislators on these issues, developing a legislative agenda, and advocating for gender balance in leadership throughout both the public and private sectors (Cecilia Zamora, National Association of Commissions for Women, personal communication, May 1, 2015).
The National Women’s Political Caucus (NWPC) is a multi-partisan, grassroots organization dedicated to increasing the number of women who run for office and who are elected or appointed into leadership positions (National Women’s Political Caucus 2015). The NWPC has state and local chapters that work with women in their communities to provide institutional support by recruiting women to run for office, endorsing women candidates, helping them raise campaign contributions, and providing them with campaign trainings (National Women’s Political Caucus 2015).
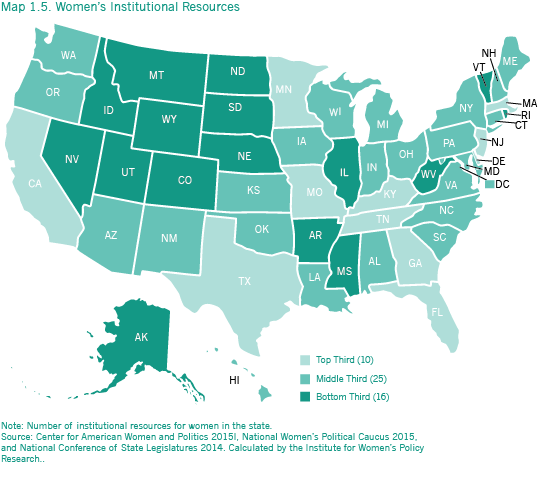
- Thirty-five states have state-level campaign trainings specifically for women, 34 states have a women’s commission, 33 states have a women’s PAC, and 16 states have chapters of the National Women’s Political Caucus (Appendix Table B1.6).
- Ten states have all four of these institutional resources for women at the state level: California, Florida, Georgia, Kentucky, Massachusetts, Minnesota, Missouri, New Jersey, Tennessee, and Texas. These states are all tied for the first place ranking and are shown as the top third in Map 1.5. An additional 14 have three institutional resources and are all tied for 11th place. Ten states plus the District of Columbia have two. This group of 25 jurisdictions is shown as the middle third in Map 1.5. The bottom third consists of 15 states that have one institutional resources and the one state—North Dakota—that has no resources to help women in their political participation. North Dakota ranks 51st on this indicator of women’s status (Appendix Table B1.6).
Labor Unions and Women’s Leadership
The labor movement spearheaded many of the basic workplace protections we enjoy today, such as the minimum wage, the 40-hour work week, overtime pay, and adequate workplace health and safety. Unions play an important role in collective bargaining for workers’ rights, and in raising issues to the forefront of the national agenda. On many policy issues, labor unions have taken the lead in both national and state policy development.
Women’s participation in unions is beneficial for several reasons. Unionized women have greater earnings—$212, or 30.9 percent more per week—and higher rates of health insurance coverage than nonunionized women (IWPR 2015c; IWPR 2015d). Women’s leadership is also critical to promoting issues of importance to women and families—including paycheck fairness, access to affordable child care, raising the minimum wage, and expanding access to paid sick days—and raising these issues to the forefront of unions’ agendas.
Women make up a large proportion of union members and have been closing the gender gap in union membership. In 2004, 57.4 percent of members were male, while 42.6 percent were female (U.S. Department of Labor 2005). By 2014, women were 45.5 percent, or 6.6 million of 14.6 million union members (U.S. Department of Labor 2015a). Of wage and salary workers overall in the United States, 11.7 percent of men and 10.5 percent of women are members of unions, with public sector workers five time as likely to belong to a union as private sector workers (35.7 percent compared with 6.6 percent; U.S. Department of Labor 2015b).
Women are also working toward better representation within union leadership. Women are 18.2 per-cent (10 out of 55) of the Executive Council of the AFL-CIO, 25.7 percent (9 of 35) of the International Vice Presidents of AFSCME, 38.1 percent (8 of 21) of the Executive Board of the CWA, 42.9 percent (18 of 42) of the AFT Vice Presidents, 50.0 percent (4 of 8) of the leadership of SEIU, and 60.0 percent (3 of 5) of the General Officers of UNITE (AFL-CIO 2015; AFSCME 2015; AFT 2015; CWA 2015; SEIU 2015; UNITE HERE 2015). While these numbers do not provide information about the leadership of the local chapters of these unions, they do speak to the composition of their national union leaderships.
Several obstacles often make it difficult for women to get involved in union leadership. One qualitative study of women union activists identified six barriers that women face in union work: women experience difficulty making room for the time demands of union leadership, especially given their competing family obligations; women and people of color have an acute fear of retribution by employers; few women serve at the top of union leadership, where they could serve as role models to other women activists; women express discomfort with public authority based on an understanding that this is not a female role; women are not aware of how union leadership may benefit their lives as workers; and unions place inadequate emphasis on the priorities and concerns of women (Caiazza 2007). The report also identified seven strategies for promoting women’s leadership within unions. Unions can highlight the importance of women’s contributions; provide trainings on effective ways to mobilize women; encourage and support more women in leadership positions both nationally and locally; create and strengthen mentoring programs for women; provide dedicated space for women to voice their concerns; address women’s priorities by using imagery and language that reflects their experiences; and provide flexible options for involvement by finding creative times and places to meet and providing supports such as childcare (Caiazza 2007).
These strategies encourage women’s activism and strengthen unions by enabling them to be more inclusive of the needs and priorities of all their members.
Conclusion
Although there are many institutions that promote women’s civic engagement and political participation, obstacles to women’s political participation and leadership persist. Women’s lesser economic resources (as shown in other releases from the Status of Women in the States project) compared with men’s, their greater caregiving responsibilities, their more limited access to important supports that would help them to run for office, and succeed as office holders, and the greater scrutiny that women candidates seem to face from the public and the media all restrict women’s political participation and leadership in states across the nation. Progress in advancing women’s political status continues to move at a glacial pace. As of 2015, women’s representation at all levels of government remains well below their share of the overall population. IWPR projects that women will not reach 50 percent of the U.S. Congress until 2117 (IWPR 2015a). Efforts to recruit more women to run for office and to increase their success as candidates and office holders will be crucial to increasing their representation in the coming years and decades.
Appendix Tables