In This Section:
The Poverty and Opportunity Composite Score
Trends in Poverty and Opportunity
- The Patient Protection and Affordable Care Act
- Health Insurance Coverage by Race and Ethnicity
- Health Insurance Coverage Among Women by Union Status
Women Business Owners and Self-Employment
Women’s Poverty and Economic Security
- The Official and Supplemental Poverty Measures
- Poverty by Race and Ethnicity
- Poverty by Household Type
- Poverty and Opportunity Among Millennial Women
- Poverty and Opportunity Among Older Women
- Poverty and the Social Safety Net
- Poverty, Opportunity, and Economic Security Among Women Living with Same-Sex Partners
- Poverty and Opportunity Among Immigrant Women
Introduction
Access to quality education and training, health care services, and business networks can help women to thrive in the workforce and achieve economic success. Yet even with access to these resources, many women struggle to achieve financial security and independence. Women are as likely as men to complete a college degree and are more likely than men to have health insurance, but face higher poverty rates than men and are much less likely to own businesses (IWPR 2015a; IWPR 2015b).
This chapter examines four topics that are integral to women’s economic security: access to health insurance coverage, educational attainment, business ownership, and poverty. It calculates a composite index comprised of these indicators, ranks each state and the District of Columbia on the composite score and the component indicators, and examines the relationships among these indicators and their implications for women’s well-being. The chapter also examines trends in the data across time and disparities that exist among racial and ethnic groups in this area of women’s status.
The Poverty and Opportunity Composite Score
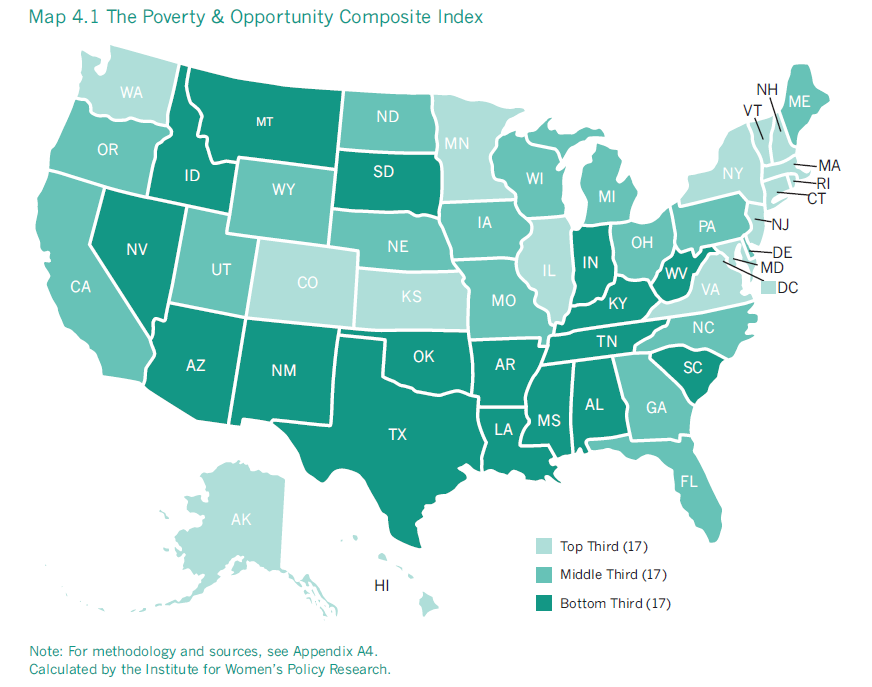
The poverty and opportunity composite index combines four component indicators of women’s economic security and access to opportunity: health insurance coverage, college education, business ownership, and the poverty rate.1 Composite scores ranged from a high of 8.00 to a low of 6.18, with the higher scores reflecting a stronger performance in the area of poverty and opportunity and receiving a higher letter grade (Table 4.1).
| Best and Worst States on Women’s Poverty and Opportunity | |||||
| State | Rank | Grade | State | Rank | Grade |
| District of Columbia | 1 | A- | Mississippi | 51 | F |
| Maryland | 2 | B+ | Arkansas | 50 | F |
| Massachusetts | 3 | B+ | West Virginia | 49 | D- |
| Connecticut | 4 | B | Kentucky | 48 | D- |
| Hawaii | 5 | B | Louisiana | 47 | D- |
- Among all 50 states and the District of Columbia, the District of Columbia has the highest score on the composite poverty and opportunity index. The District ranks first in the nation for the percentage of women with a bachelor’s degree or higher and share of businesses that are women-owned, and second on the percentage of nonelderly women with health insurance. On the percentage of women living above poverty, however, the District of Columbia ranks 47th, reflecting the high degree of inequality among the city’s residents.
- Mississippi has the lowest score on the composite poverty and opportunity index. It ranks last on the percentage of women above poverty, and among the bottom ten on the percentage of women with health insurance coverage and with a bachelor’s degree or higher. Mississippi’s best ranking is on women-owned businesses, where the state comes in 30th place, in the middle third.
- Four states in the Northeast—Connecticut, Massachusetts, New Hampshire, and Vermont—rank in the top ten on the poverty and opportunity composite index. Colorado, Hawaii, Maryland, Minnesota, and Virginia are also in this highest-ranking group.
- In general, the South and some parts of the West score poorly on the composite index for poverty and opportunity. In addition to Mississippi, six Southern states—Alabama, Arkansas, Kentucky, Louisiana, Tennessee, and West Virginia—are among the ten states with the lowest scores. They are joined by Idaho, New Mexico, and Oklahoma.
- The District of Columbia received the highest grade on the poverty and opportunity index, an A-. This grade reflects both the District’s accomplishments—its well above average scores for the percentage of women with health insurance coverage, the percentage of women with a bachelor’s degree or higher, and the share of businesses that are women-owned—and its need for improvement in the area of women’s poverty.
Trends in Poverty and Opportunity
Women’s status in the area of poverty and opportunity in the United States has improved on two indicators since the publication of IWPR’s 2004 Status of Women in the States report and declined on two others. The share of women with a bachelor’s degree or higher increased 6.9 percentage points during this time period, from 22.8 to 29.7 percent, and the share of women-owned businesses increased from 26.0 to 28.8 percent. The percent of women living above poverty, however, declined from 87.9 in 2002 to 85.4 in 2013 (IWPR 2004; U.S. Department of Commerce 2014a).2 The percent of women with health insurance in 2013 (81.5) was also slightly lower than in 2002 (82.3 percent), but the 2013 data do not reflect shifts in coverage following the passage of the Patient Protection and Affordable Care Act (ACA) of 2010.
- On the composite score for women’s poverty and opportunity status, 21 states and the District of Columbia have gained ground, while 29 have lost ground. The places experiencing the largest gains are the District of Columbia and Hawaii, whose composite scores increased by 5.3 and 3.8 percent, respectively.
- Among states that have declined, Indiana experienced the biggest loss, with a 3.3 percent decrease in its composite score. The state with the second largest loss was Nevada, with a decrease of 2.9 percent.
Access to Health Insurance
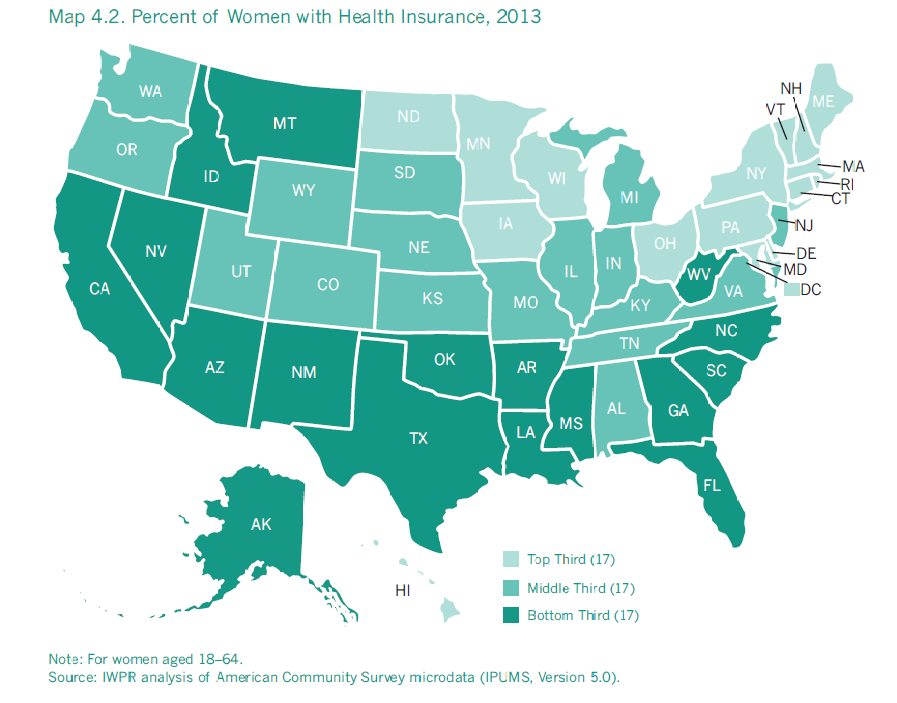
Health insurance gives women access to critical health services that can also contribute to well-being in other areas of their lives, such as their economic and employment status. In the United States, 81.5 percent of nonelderly women (aged 18–64) had health insurance coverage in 2013, a slightly higher proportion than men of the same age range (77.1 percent; Figure 4.1). According to IWPR analysis of 2013 American Community Survey microdata, 59.6 percent of nonelderly women were insured through a union or employer, either their own or their spouse’s. Medicare covered 3.8 percent of nonelderly women, and Medicaid and other means-tested programs covered 15.6 percent. Approximately 9.5 percent of women had health insurance purchased directly from an insurance company.3
- In 2013, women aged 18–64 were the most likely to have health insurance coverage in Massachusetts (96.2 percent), followed by the District of Columbia (94.3 percent) and Vermont (93.3 percent; Table 4.1). Other jurisdictions that ranked highly were scattered throughout the country: Connecticut, Delaware, Hawaii, Iowa, Maryland, Minnesota, Pennsylvania, and Wisconsin were in the top 11 states. Delaware, Maryland, and Pennsylvania tied for ninth place.
- Women in a band of Southern and Southwestern states were the least likely to have health insurance coverage. Texas had the lowest percentage of women aged 18–64 with coverage (71.7 percent), followed by Florida (73.8 percent). Arkansas, Georgia, Louisiana, Mississippi, and New Mexico all ranked in the bottom ten. They were joined by Idaho, Nevada, and Oklahoma.
- The Patient Protection and Affordable Care Act (ACA) dramatically reduced rates of uninsurance among women aged 18 to 24, by allowing adult children to stay on their parents’ health insurance plans until the age of 26. Between 2008 and 2014, the percentage of women aged 18 to 24 without health insurance decreased by more than a third, from 24.9 to 15.9 percent. Uninsurance rates for women of all ages dropped 18.5 percent between 2008 and 2014, from 13.0 of women lacking insurance in 2008, to 10.6 percent in the first nine months of 2014 (Martinez and Cohen 2009 and 2015). Complete data reflecting health insurance changes following the ACA, including state by state data, are not yet available.
| Best and Worst States on Women’s Health Insurance | |||||
State |
Percent with Health Insurance |
Rank |
State |
Percent with Health Insurance |
Rank |
Massachusetts |
96.2% |
1 |
Texas |
71.7% |
51 |
District of Columbia |
94.3% |
2 |
Florida |
73.8% |
50 |
Vermont |
93.3% |
3 |
Nevada |
74.3% |
48 |
Minnesota |
90.9% |
4 |
New Mexico |
74.3% |
48 |
Hawaii |
90.8% |
5 |
Georgia |
75.5% |
47 |
 The Patient Protection and Affordable Care Act
The landscape of women’s health insurance coverage is changing as a result of the passage of the Patient Protection and Affordable Care Act (ACA) of 2010. The ACA enacted measures designed to expand access to affordable health insurance coverage for women and men in the United States who lack coverage. It led to state-based exchanges through which individuals can purchase coverage, with premium and cost-sharing benefits available to those with low incomes. It has also established separate exchanges through which small businesses can purchase health insurance coverage for their employees. Along with these changes, the Affordable Care Act requires U.S. citizens and legal residents to acquire insurance or pay a penalty, with some exemptions related to factors such as financial hardship and religious objections (Kaiser Family Foundation 2013a). As of 2013, the ACA allowed adult children to stay on their parents’ health insurance until the age of 26.
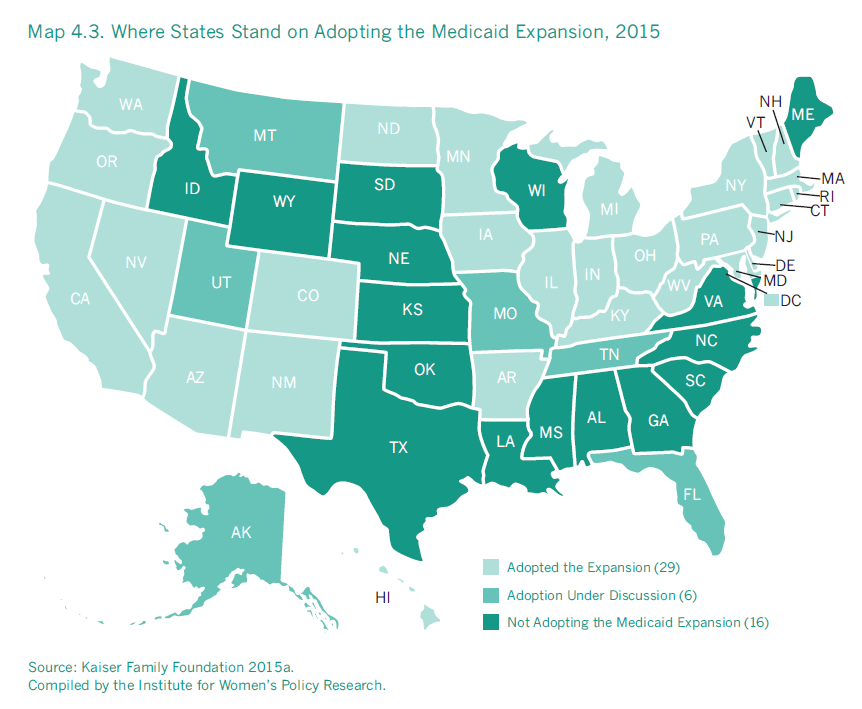
To help those who may have struggled in the past to afford insurance, the ACA seeks to expand Medicaid eligibility to all individuals under age 65 who are not eligible for Medicare and have incomes up to 138 percent of the federal poverty line (individuals were previously eligible only if they were pregnant, the parent of a dependent child, 65 years of age or older, or disabled, in addition to meeting income requirements; National Conference of State Legislatures 2011).4 States can choose to opt out of this Medicaid expansion, however; as of March 2015, 28 states and the District of Columbia had chosen to expand Medicaid coverage, and six were in the process of deciding whether to do so (Map 4.3).
 Health Insurance Coverage by Race and Ethnicity
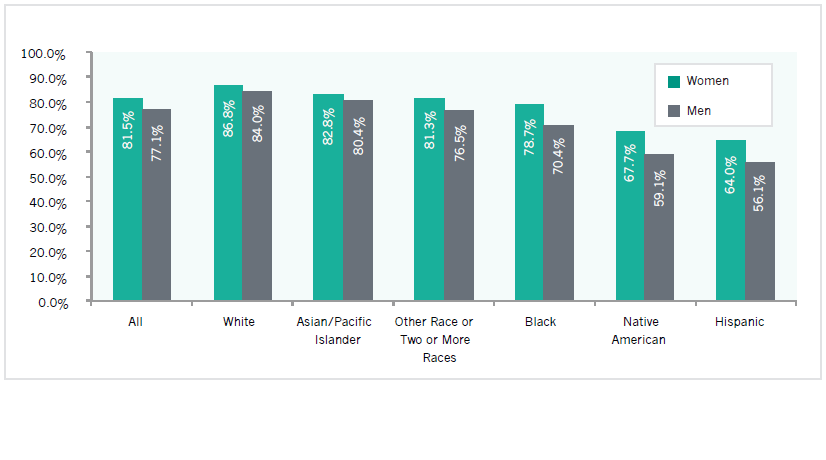
Health insurance coverage rates vary by race and ethnicity. Among the largest racial and ethnic groups, white (86.8 percent) and Asian/Pacific Islander (82.8 percent) women had the highest rates of coverage in 2013. Hispanic and Native American women had the lowest rates at 64.0 and 67.7 percent, respectively (Figure 4.1). For all racial and ethnic groups shown below, women had higher coverage rates than men.
Figure 4.1 Health Insurance Coverage Rates by Gender and Race/Ethnicity, Aged 18–64, United States, 2013
 Note: Racial categories are non-Hispanic. Hispanics may be of any race or two or more races.
Source: IWPR analysis of American Community Survey microdata (IPUMS, Version 5.0).
Health insurance coverage rates also varied considerably across detailed racial and ethnic groups in 2013. Japanese women had the highest rate of coverage among Asian/Pacific Islander women at 91.1 percent, and Korean women had the lowest rates of coverage at 71.9 percent. For Hispanic women, Spanish and Puerto Rican women were the most likely to be covered at 83.1 and 82.9 percent, respectively. Fewer than half of women of Guatemalan (48.0 percent) and Honduran (46.1 percent) descent had coverage; the coverage rates for these groups were the lowest not only among all Hispanic women, but also among all detailed racial and ethnic groups shown in Appendix Table B4.3. Among Native Americans, the Iroquois (79.1 percent) and the Lumbee and Chippewa (each 72.7 percent) were the most likely to have coverage, and the Pueblo (56.1 percent) and Sioux (60.0 percent) were the least likely.
Health Insurance Coverage Among Women by Union Status
Women who are union members (or covered by a union contract) are more likely to receive health insurance benefits through their job than those who are not unionized. As of 2013, approximately three in four unionized women (76.6 percent) had employer- or union-provided health insurance coverage, compared with about half (51.4 percent) of their nonunion counterparts (Figure 4.2). Among the largest racial and ethnic groups, the difference between coverage rates for union members and nonunion members were greatest for Hispanic women and women who identify with another race or two or more races (29.2 and 27.4 percentage points, respectively; Figure 4.2).5
Figure 4.2. Percent of Employed Women with Health Insurance Coverage through Their Employer or Union by Race/Ethnicity and Union Status, United States, 2013
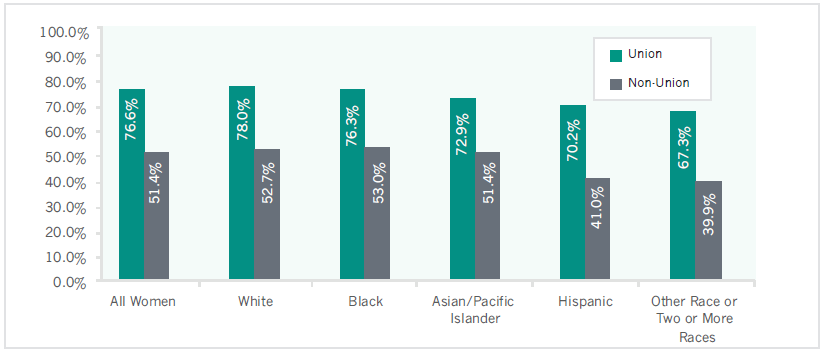 Note: Racial categories are non-Hispanic. Hispanics may be of any race or two or more races. Data include workers aged 15 and older and are three-year averages (2012–2014). Native Americans are included in “other race or two or more races”; sample sizes are insufficient to report estimates for Native Americans separately.
Source: IWPR analysis of the Current Population Survey Annual Social and Economic Supplement.
Education
Women in the United States have closed the gender gap in education over the past several decades, aided in part by the passage of Title IX of the 1972 Education Amendments, which prohibited discrimination in educational institutions (Rose 2015). While men outnumbered women among those receiving bachelor’s degrees throughout the 1970s, women surpassed men in 1981 and have received more bachelor’s degrees in every year since then. During the 2012–2013 academic year, women comprised 57 percent of the nation’s college students (Rose 2015).
Educational attainment has improved substantially among men in the United States as well as among women in recent years, but women have made progress at a faster rate. In 1990, 23.3 percent of men aged 25 and older held at least a bachelor’s degree, while only 17.6 percent of women had such credentials (U.S. Department of Commerce 1994). In 2000, 26.1 percent of men and 22.8 percent of women aged 25 and older had completed a bachelor’s degree or higher (Bauman and Graf 2003). In 2013, women not only outnumbered men among those receiving bachelor’s degrees, but the share of women who held these degrees also slightly surpassed the share of men who had obtained them: 29.7 percent of women and 29.5 percent of men aged 25 and older held a bachelor’s degree or higher (Table 4.1 and Appendix Table B4.1).
| Best and Worst States on Women’s Education | |||||
State |
Percent with a Bachelor’s Degree |
Rank |
State |
Percent with a Bachelor’s Degree or Higher |
Rank |
District of Columbia |
53.50% |
1 |
West Virginia |
19.10% |
51 |
Massachusetts |
40.30% |
2 |
Arkansas |
20.70% |
50 |
Maryland |
38.10% |
3 |
Mississippi |
21.60% |
49 |
Colorado |
37.50% |
4 |
Nevada |
22.20% |
48 |
Connecticut |
37.40% |
5 |
Kentucky |
22.70% |
47 |
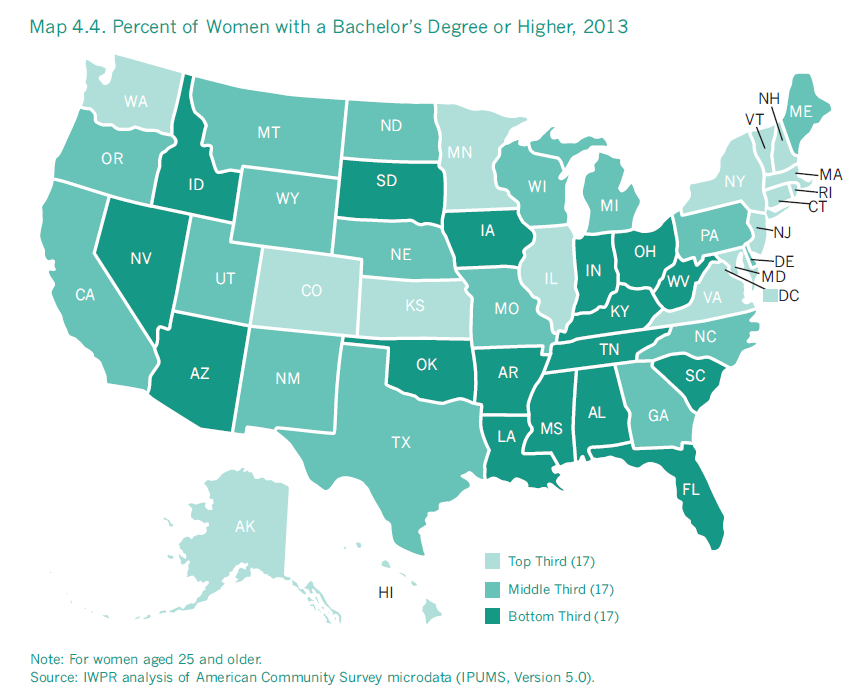
The District of Columbia has, by far, the largest percentage of women with a bachelor’s degree or higher. More than half (53.5 percent) of women aged 25 and older in the nation’s capital hold this level of education. Massachusetts is a distant second, with 40.3 percent of women holding at least a bachelor’s degree. The District of Columbia also ranked first on this indicator when the 2004 Status of Women in the States report was published.Women’s educational attainment varies considerably across states.
- In West Virginia, fewer than one in five (19.1 percent) women aged 25 and older hold a bachelor’s degree or higher, the lowest percentage in the nation. West Virginia also came in last place in the 2004 Status of Women in the States rankings on women’s educational attainment.
- In general, women in the Northeast and Mid-Atlantic have relatively high levels of education. In addition to the District of Columbia and Massachusetts, six states in these regions—Connecticut, Maryland, New Hampshire, New Jersey, New York, and Vermont—rank in the top ten for women’s educational attainment. Colorado and Virginia are also in the top ten.
- Women in the South have comparatively lower levels of education. In addition to West Virginia, six Southern states—Alabama, Arkansas, Kentucky, Louisiana, Mississippi, and Tennessee—rank in the bottom ten for the percent of women with a bachelor’s degree or higher. Indiana, Nevada, and Oklahoma are also in this lowest-ranking group.
- In all states and the District of Columbia, the share of women who hold at least a bachelor’s degree has increased since 2000. The District of Columbia, Massachusetts, and New Hampshire have experienced the largest gains, with increases of 16.7, 8.9, and 8.8 percentage points, respectively (IWPR 2004; Table 4.1). New Mexico, Arkansas, and Mississippi have seen the smallest gains, with increases of 4.7, 4.8, and 5.0 percentage points.
- The proportion of women aged 25 and older with a bachelor’s degree or higher is larger than the proportion of men in 29 states. The differences are greatest in Alaska (7.7 percentage points) and Vermont (6.1 percentage points). Among the jurisdictions where men are more likely to hold a bachelor’s degree or higher, the gender difference in education is largest in Utah (4.8 percentage points) and the District of Columbia (2.1 percentage points; Table 4.1 and B4.1).
Although more women are receiving high school diplomas and completing college than ever before (U.S. Department of Education 2013; U.S. Department of Education 2014), a significant proportion of women either do not finish high school or end their education with only a high school diploma. In 2013, 12.8 percent of women aged 25 and older in the United States had not completed high school, and 27.3 percent had a high school diploma or the equivalent as their highest level of educational attainment (Appendix Table B4.4).
- Among the 50 states and the District of Columbia, the three jurisdictions with the highest shares of women with less than a high school diploma are California (18.0 percent), Texas (17.5 percent), and Mississippi (16.0 percent).
- Wyoming has the smallest share of women with less than a high school diploma at 5.8 percent, followed by Vermont (6.5 percent) and Montana (6.7 percent). Although Wyoming has proportionately few women at the low end of the education spectrum, it also has a smaller share of women with a bachelor’s degree or higher than in the nation overall (26.9 percent compared with 29.7 percent). In Wyoming, women are most likely to have some college education or an associate’s degree (42.0 percent) and are considerably more likely to have this level of education than women in the United States overall (30.3 percent).
Educational Attainment by Race and Ethnicity
The educational progress women have made has not been distributed equally across racial and ethnic groups. As Figure 4.3 shows, Asian/Pacific Islander women are the most likely to hold a bachelor’s degree or higher (48.4 percent), followed by women who identify with who identify with another race or two or more races (32.6 percent) and white women (32.5 percent). Native American and Hispanic women are the least likely to hold at least a bachelor’s degree (15.5 percent and 15.3 percent, respectively). One in three Hispanic women (33.9 percent) has less than a high school diploma; the proportion of Hispanic women with this level of education is approximately twice as large as the proportion of Native American women, the group with the second largest share of women holding the lowest level of education. White women are the least likely to have less than a high school diploma.
Figure 4.3. Educational Attainment Among Women by Race and Ethnicity, Aged 25 and Older, United States, 2013
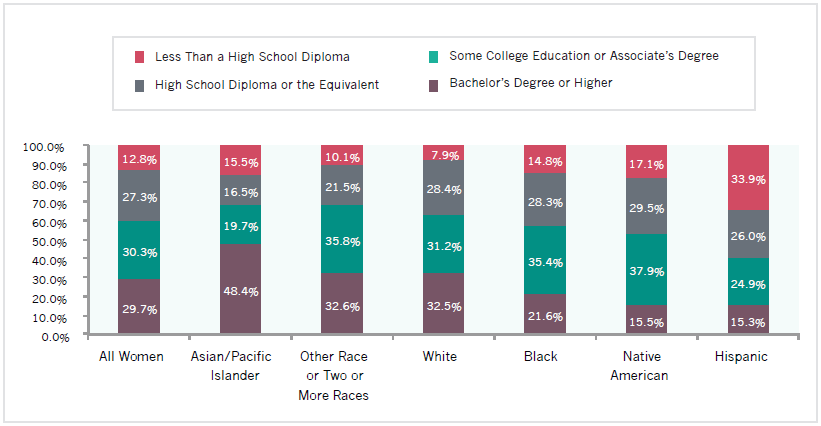 Note: Racial categories are non-Hispanic. Hispanics may be of any race or two or more races.
Source: IWPR analysis of American Community Survey microdata (IPUMS, Version 5.0).
Disparities also exist within the Asian/Pacific Islander, Hispanic, and Native American populations. Among the Asian/Pacific Islander groups shown in Appendix Table B4.3, approximately two-thirds of Indian women (67.9 percent) and more than half of Filipino women (51.4 percent) have a bachelor’s degree or higher; among the two lowest-ranking groups, women who identify as Samoan or Guamanian/Chamorro, fewer than one in seven (12.2 and 13.8 percent, respectively) hold this level of education. Among Hispanic women, the disparities are not quite as large but still substantial: the proportion with a bachelor’s degree or higher is largest among women of Venezuelan (49.7 percent) and Argentinian descent (42.1 percent), and smallest among those of Salvadoran and Guatemalan descent (8.8 and 9.3 percent). Among Native American women, the Chickasaw (24.6 percent) and the Iroquois (22.6 percent) are the most likely to hold at least a bachelor’s degree, and the Apache (7.8 percent) and Alaska Natives (9.4 percent) are the least likely. The groups with higher levels of education also have, on average, higher earnings (Appendix Table B4.3; IWPR 2015c).
Gender Differences in Fields of Study
The fields of study that women choose in college have implications for their earnings once they graduate. In general, women tend to be concentrated in fields that lead to jobs with relatively low wages, such as social work and early childhood education, whereas men tend to be concentrated in fields that lead to higher-paying jobs, such as Science, Technology, Engineering, and Mathematics fields (Carnevale, Strohl, and Melton 2011). Analysis of the earnings of women and men with terminal bachelor’s degrees in different fields indicates that women are fewer than half of workers in all ten fields with the highest median annual earnings for women. In some of these fields, they are a very small percentage of workers; for example, in electrical and mechanical engineering—which tied for fourth place among the top ten majors with the highest earnings for women—women are just seven percent of those with a terminal bachelor’s degree. By contrast, men are more than 90 percent of terminal bachelor’s degree holders in eight of the ten majors with the highest earnings for men (Carnevale, Melton, and Strohl 2011).6
In addition, women who go into higher-paying fields generally earn less than their male counterparts. Carnevale, Strohl, and Melton (2011) found that for nine out of the ten majors with the highest earnings for women, the earnings of women who had bachelor’s degrees in these fields and worked full-time, year-round were less than the earnings of similar men.7 Only women with bachelor’s degrees in information sciences earned more than their male counterparts.
Women Business Owners and Self-Employment
Like education, business ownership can bring women increased control over their working lives and create financial and social opportunities. Nationally, 28.8 percent of businesses are women-owned (IWPR 2015b); the large majority are owner-operated and have no other employees (88.3 percent), which is also true for men-owned businesses, although the share of men-owned firms with no other employees is lower (U.S. Department of Commerce 2010). Business ownership can encompass various arrangements, from owning a corporation, to consulting, to providing child care in one’s home.
Between 1997 and 2007, the proportion and number of women-owned businesses in the United States increased from 26.0 percent (5.4 million businesses) to 28.8 percent (7.8 million businesses; U.S. Small Business Administration 2011). Many of these businesses are in industries that employ more women than men. For example, more than six in ten (61 percent) health care and education firms are women-owned. In traditionally male-dominated industries, the shares of businesses owned by women are much smaller. Women own only 35 percent of businesses in professional, scientific, and technical services; 32 percent in finance, insurance, and real estate; 25 percent in manufacturing; and 14 percent in transportation and warehousing (U.S. Department of Commerce 2010).
Women-owned businesses are concentrated in industries where firms are usually smaller and have smaller sales/receipts than the industries in which men-owned businesses are concentrated. The average sales/receipts for women-owned businesses in the United States are about one-fourth of the average sales/receipts for men-owned businesses (U.S. Department of Commerce 2010). Nationally, women-owned businesses account for only 11 percent of sales and 13 percent of employment of all privately-held businesses, which is a considerably smaller proportion than women’s share of the ownership of all privately-held businesses (U.S. Department of Commerce 2010).
| Best and Worst States on Women’s Business Ownership | |||||
State |
Percent of Businesses Owned by Women |
Rank |
State |
Percent of Businesses Owned by Women |
Rank |
District of Columbia |
34.5% |
1 |
South Dakota |
22.1% |
51 |
Maryland |
32.6% |
2 |
Idaho |
23.5% |
50 |
New Mexico |
31.7% |
3 |
Arkansas |
24.5% |
49 |
Hawaii |
31.0% |
4 |
Montana |
24.6% |
48 |
Georgia |
30.9% |
5 |
North Dakota |
24.7% |
47 |
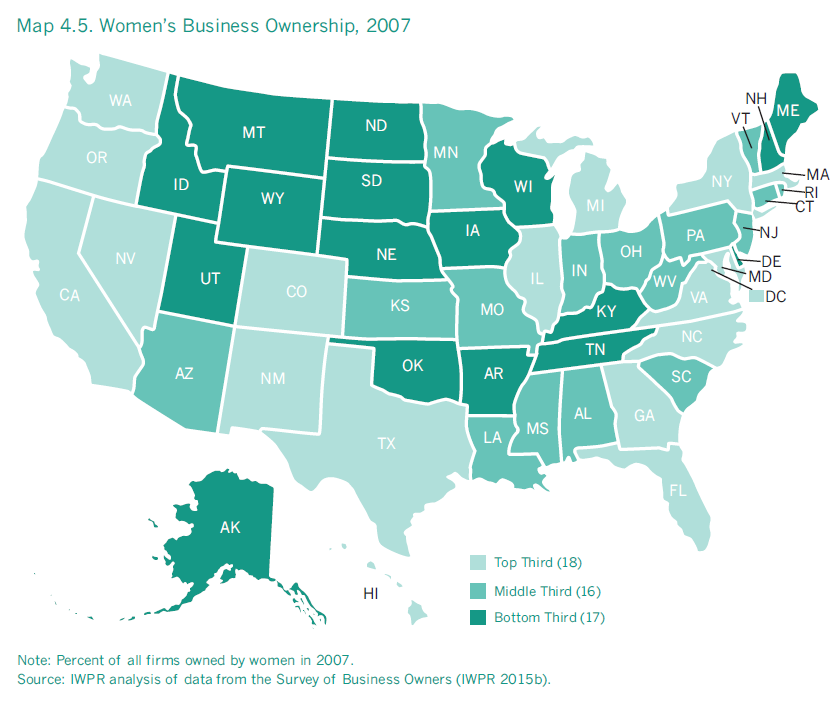
The percentage of businesses owned by women varies greatly across the states (Table 4.1).
- The District of Columbia (34.5 percent), Maryland (32.6 percent), New Mexico (31.7 percent), Hawaii (31.0 percent), and Georgia (30.9 percent) have the highest shares of women-owned businesses. Other states that rank in the top ten on this indicator include California, Illinois, Michigan, New York, and Virginia.
- South Dakota has the smallest share of businesses that are women-owned (22.1 percent), followed by Idaho (23.5 percent), Arkansas (24.5 percent), Montana (24.6 percent), and North Dakota (24.7 percent). Other states in the bottom eleven include Iowa, Kentucky, Maine (tied with Kentucky for 41st place), Oklahoma, Utah, and Wyoming.
One study (American Express Open 2014) that estimated growth in the number and economic clout of women-owned businesses between 1997 and 2014 found that growth in these businesses varies considerably across states.
- Seven of the top ten states with the fastest estimated growth in women-owned businesses between 1997 and 2014 are in the South: Georgia (117.9 percent), Texas (98.4 percent), North Carolina (91.4 percent), Mississippi (81.4 percent), South Carolina (78.3 percent), Florida (76.5 percent), and Alabama (76.1 percent). Nevada (90.6 percent), Maryland (74.7 percent), and Utah (73.8 percent) are also in the top ten (American Express Open 2014).
- The ten lowest-ranking states for the estimated growth in women-owned businesses between 1997 and 2014 are geographically dispersed. Alaska (11.2 percent) had the slowest growth, followed by West Virginia and Iowa (22.7 percent each), Kansas (29.8 percent), and Vermont (30.4 percent). Other states with comparatively slow growth are Ohio (31.0 percent), Indiana (32.5 percent), Connecticut (33.2 percent), Maine (34.6 percent), and South Dakota (35.3 percent; American Express Open 2014).
- The District of Columbia had the fastest estimated revenue growth from women-owned businesses between 1997 and 2014 (176.0 percent). More than half of the jurisdictions in the top ten for revenue growth are in the Mountain West and Midwest: North Dakota (175.2 percent), Wyoming (163.2 percent), Utah (157.7 percent), South Dakota (119.8 percent), Nevada (111.5 percent), and Arizona (100.5 percent). Other top ten states are Louisiana (143.8 percent), New Hampshire (139.7 percent), and Virginia (105.4 percent; American Express Open 2014).
- Iowa is the only state where revenues from women-owned businesses declined between 1997 and 2014 (-3.8 percent). The four states with the smallest growth in revenues are Maine (13.8 percent), Michigan (20.1 percent), Illinois (30.8 percent), and Rhode Island (31.0 percent). Kentucky, New Jersey, South Carolina, Vermont, and Wisconsin are also in the bottom ten, but had growth rates higher than 42 percent (American Express Open 2014).
The number and share of women-owned firms that are owned by women of color has increased dramatically in recent years. In 1997, women of color—who constitute approximately 35 percent of the female population aged 18 and older (IWPR 2015a)—owned 929,445 businesses in the United States, representing 17 percent of all women-owned firms. By 2014, this number had grown to an estimated 2,934,500, or 32 percent of women-owned firms (American Express Open 2014). Firms owned by black or African American women have experienced the most rapid growth; between 1997 and 2014, African American women-owned firms are estimated to have grown by 296 percent and their revenues to have increased by 265 percent, surpassing the growth among all women-owned firms (which are estimated to have increased in number by 68 percent and in revenues by 72 percent during the same time period). Asian American, Latinas, and Native Hawaiian/Pacific Islander women-owned firms have also experienced more rapid growth in the number of firms and revenues than all women-owned firms. Native American/Alaska Native women-owned firms, however, experienced greater growth in number of firms than all women-owned firms, but did not experience an increase in revenues at a pace greater than that of than all women-owned firms between 1997 and 2014 (American Express Open 2014). Among firms owned by non-minority women, growth in both the number of firms (37 percent) and revenues (58 percent) was slower than among all women-owned businesses.
Like women’s business ownership, women’s self-employment (a form of business ownership) has increased over the past several decades. In 1976, women made up just over a quarter of the self-employed workforce (26.8 percent); in 2013, they were 40.7 percent (U.S. Bureau of Labor Statistics 2014). In 2013, 5.2 percent of employed women in nonagricultural industries were self-employed compared with 6.7 percent of similarly employed men (U.S. Bureau of Labor Statistics 2014). Among both women and men, self-employed individuals are more likely to have college degrees than those who are not self-employed. They are also more likely to be married and older, which means they are less likely to have young children in their care (U.S. Department of Commerce 2010).
Self-employed women work slightly more hours per week than women who are not self-employed (40.1 hours per week, on average, compared with 38.9 hours; U.S. Department of Commerce 2010). Despite working more hours, self-employed women have slightly lower average annual earnings than women who are not self-employed ($38,172 compared with $38,670). They also face a larger gender wage gap; the average annual earnings of women who are self-employed are 55 percent of the earnings of their male counterparts, compared with 70 percent among women and men who are not self-employed.8 When controlling for the average number of hours worked per week and the number of weeks worked in the year, the gender wage gap narrows for both women who are self-employed and those who are not self-employed, but self-employed women still face a lower gender earnings ratio (63 percent compared with 77 percent for women who are not self-employed; U.S. Department of Commerce 2010).
Women’s Poverty and Economic Security
Women’s economic security is directly linked to their family income, which includes not only earnings from jobs and any other family members but also income from other sources, such as investments, retirement funds, Social Security, and government benefits. Many women in the United States enjoy comfortable family incomes, but others struggle to make ends meet. IWPR analysis of data from the Current Population Survey (U.S. Department of Commerce 2014a) indicates that 14.5 percent of women aged 18 and older in 2013 had family incomes that placed them below the federal poverty line, compared with 11.0 percent of men.
| Best and Worst States on Women’s Poverty | |||||
State |
Percent Above Poverty |
Rank |
State |
Percent Above Poverty |
Rank |
Alaska |
91.0% |
1 |
Mississippi |
75.7% |
51 |
New Hampshire |
90.8% |
2 |
New Mexico |
78.5% |
50 |
Maryland |
89.6% |
3 |
Louisiana |
80.0% |
49 |
Connecticut |
89.4% |
4 |
Kentucky |
80.9% |
48 |
Hawaii |
89.3% |
5 |
District of Columbia |
81.1% |
47 |
Women’s poverty rates vary across states (Table 4.1).
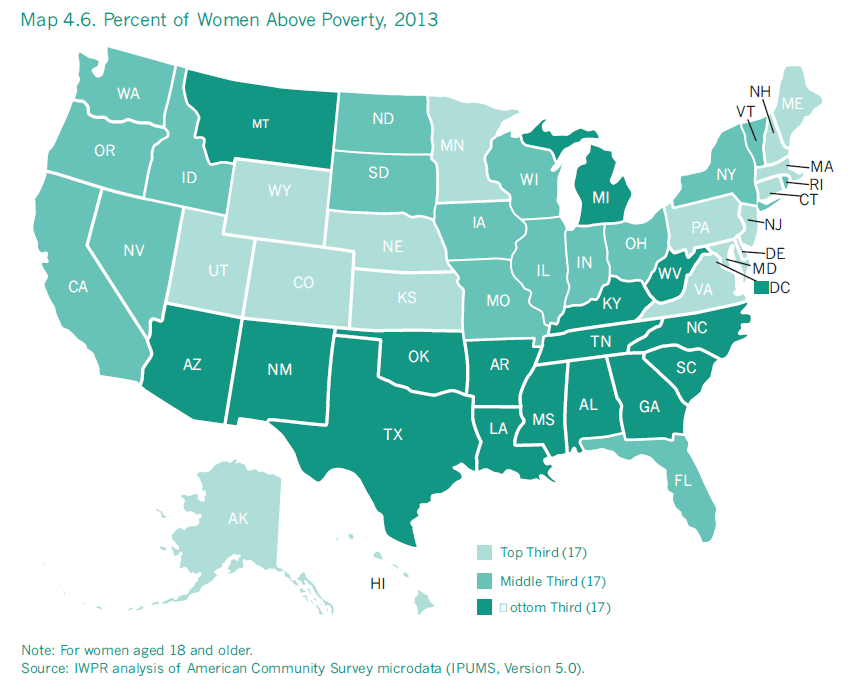
- Women in Alaska are the least likely to live in poverty; more than nine in ten (91.0 percent) women in this state live in families with incomes above the federal poverty line. New Hampshire and Maryland rank second and third, with 90.8 and 89.6 percent of women living above poverty.
- Women are the most likely to live in poverty in Mississippi, where only 75.7 percent of women have family incomes above the poverty line. In New Mexico and Louisiana, the second and third worst states on this indicator, 78.5 percent and 80.0 percent of women live above poverty.
- States with relatively low poverty rates for women are geographically dispersed. In addition to Alaska, New Hampshire, and Maryland, two states from the New England—Connecticut and Massachusetts—rank in the top ten. Other states in this highest-ranking group include Hawaii, Minnesota, New Jersey, Virginia, and Wyoming.
- Women in the South are the most likely to be poor. In addition to Louisiana and Mississippi, the District of Columbia and six Southern states—Alabama, Arkansas, Georgia, Kentucky, South Carolina, and West Virginia—all rank in the bottom ten for the percent of women above poverty. New Mexico also ranks in the bottom ten.
The Official and Supplemental Poverty Measures
While poverty remains a serious problem for many women the United States, the poverty rate alone does not fully capture the extent of the hardship that women face. Established by the federal government in the 1960s, the federal poverty threshold has been adjusted for inflation, but not for increases in widely accepted living standards, and, therefore, does not accurately measure the resources needed to avoid economic hardship (Fremstad 2010).9 A family is considered poor if its pre-tax cash income falls below the poverty threshold; as an example, the 2014 poverty threshold for a family of four with two children is $24,008 (U.S. Department of Commerce 2015)—an amount that is not sufficient to make ends meet, let alone to build assets to ensure long-term economic security. Given the inadequacy of the official poverty measure, the proportion of women and men who face economic hardship is likely much higher than the proportion living in poverty as calculated based on the federal poverty threshold.10
The Census Bureau recently developed a Supplemental Poverty Measure (SPM), which is based in large part on recommendations made by a National Academy of Sciences panel in the mid-1990s. This measure takes into account the value of the Earned Income Tax Credit (EITC), Supplemental Nutrition Assistance Program (SNAP) and certain other forms of nutrition assistance, and means-tested rental housing assistance, which are not counted as income under the current measure. The SPM also makes some modest changes to the poverty thresholds, including establishing different thresholds by housing status: the SPM poverty threshold in 2013 for renters ($25,144) and for homeowners with mortgage payments ($25,639) was higher than the official poverty threshold in this year ($23,624), but the SPM poverty threshold for homeowners without a mortgage ($21,397) was lower (Short 2014). In addition, the SPM subtracts payroll and other taxes from income, as well as out-of-pocket expenditures on child care and health care, but it does not take into account unmet health care and child care needs (Fremstad 2010). Under the SPM, poverty rates for women and men are slightly higher overall than under the official measure (about one-third of a percentage point for women and 1.6 percentage points for men; IWPR 2012 and Short 2014). The rate for female householder units remains high (nearly 29 percent) but does not change significantly, and the poverty rate for children declines, while elderly poverty rates increase (Short 2014). Poverty researchers have generally shown strong support for the SPM, although concerns have been raised about the extent to which it adequately accounts for health care and child care needs (Fremstad 2010).11
Poverty by Race and Ethnicity
Poverty rates vary considerably among adult women from the largest racial and ethnic groups. Native American women have the highest poverty rate at 28.1 percent, followed by black (25.7 percent) and Hispanic (24.0 percent) women. The poverty rate for white women is the lowest among the groups shown in Figure 4.4 and is less than half the rate for Native American, black, and Hispanic women (11.7 percent). For each of the largest racial and ethnic groups, women’s poverty rate is higher than men’s; the difference is greatest between Hispanic women and men (Figure 4.4).
Figure 4.4 Poverty Rates by Gender and Race/Ethnicity, United States, 2013
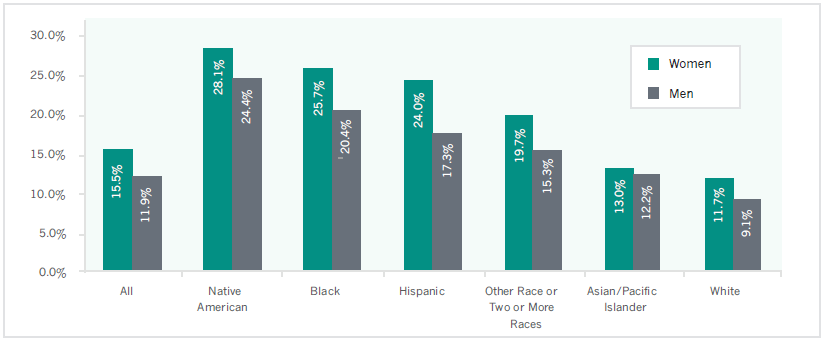 Note: Aged 18 and older.
Source: IWPR analysis of American Community Survey microdata (Integrated Public Use Microdata Series, Version 5.0).
Poverty rates also differ substantially among detailed racial and ethnic groups. Among Hispanic women, those of Honduran (30.8 percent) and Guatemalan (30.1 percent) descent had the highest poverty rates, with rates that were more than twice as high as the group with the lowest rate, women of Argentinian descent (11.7 percent; Appendix Table B4.3). Among Asian/Pacific Islander women, the groups with the highest poverty rates—those who identify as Hmong and Bangladeshi (25.8 percent and 25.7 percent)—are more than three times as likely to be poor as those who identify as Filipino and Indian, who are the least likely to be poor and have poverty rates of 7.0 and 8.4 percent, respectively. Native American women experience similar disparities, although the differences are less drastic. The Apache (38.8 percent) and Sioux (38.5 percent) are most likely to be poor, with poverty rates that are considerably higher than the rates for the Iroquois and the Choctaw, who have the lowest poverty rates among Native American women at 20.6 and 20.7 percent (Appendix Table B4.3). Differences in educational levels correspond to the disparities in poverty rates among racial and ethnic groups; the groups with the lowest poverty rates also are more likely to have college degrees.
Poverty by Household Type
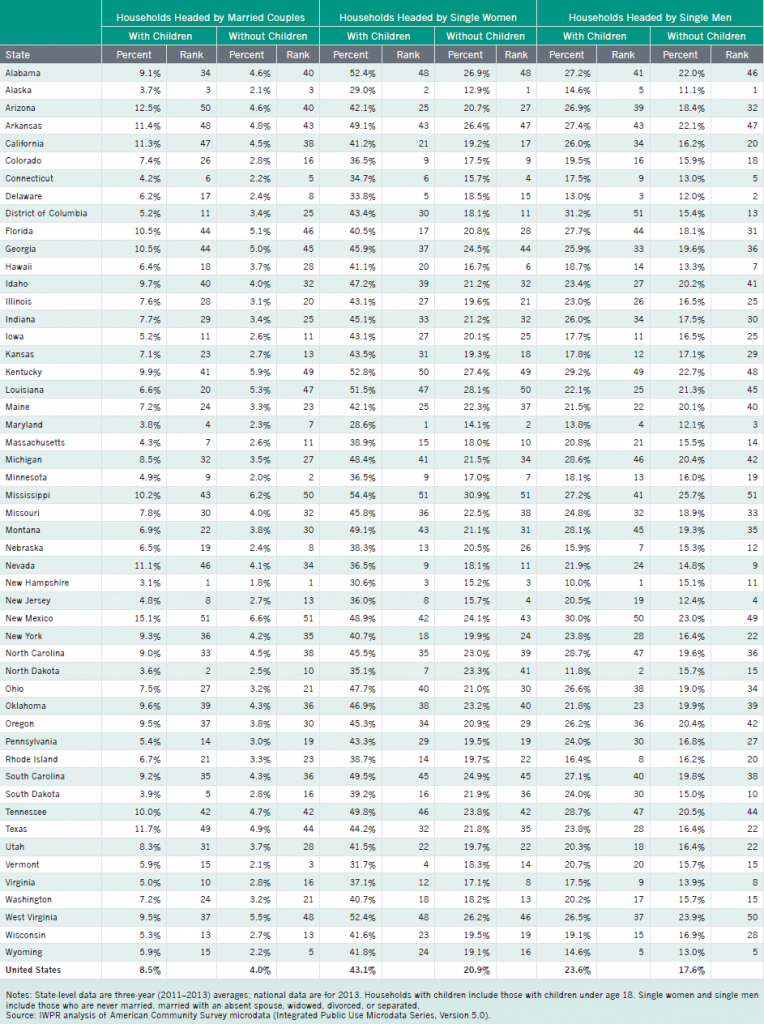
In the United States, poverty rates vary considerably by household type. Households headed by single women with children under age 18 are more likely to be poor than those headed by single men or married couples with children. More than four in ten households (43.1 percent) headed by single women with children live in poverty, compared with nearly one in four (23.6 percent) households headed by single men with children and fewer than one in ten (8.5 percent) married couples with children. Married couples without children have the lowest poverty rate (3.6 percent; Figure 4.5).
Figure 4.5. Percent of Households with Income Below Poverty by Household Type, United States, 2013
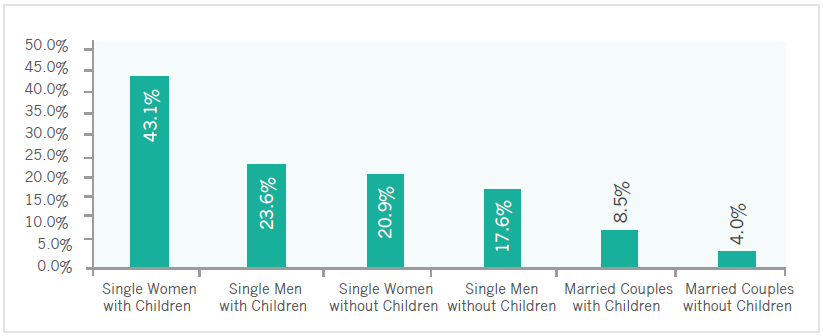
Notes: “Single women” and “single men” refer to households headed by women or men who are married with an absent spouse, separated, divorced, widowed, or never married/single. Households with children are those with children under age 18.
Source: IWPR analysis of American Community Survey microdata (Integrated Public Use Microdata Series, Version 5.0).
- Maryland, Alaska, and New Hampshire—the three states with the lowest poverty rates for women overall—have the smallest shares of single women with children living in poverty. Still, in each of these states, approximately three in ten single women with children are poor (Appendix Table B4.6).
- More than half of single women with children live in poverty in Mississippi (54.4 percent), Kentucky (52.8 percent), Alabama and West Virginia (52.4 percent each), and Louisiana (51.5 percent).
- The difference between the poverty rates of single women and men with children is largest in Louisiana (29.4 percentage points), Wyoming and Mississippi (27.2 percentage points), and West Virginia (25.9 percentage points). It is smallest in Vermont (11.0 percentage points), the District of Columbia (12.2 percentage points), and Florida (12.8 percentage points).
Multiple factors contribute to women’s higher poverty rate compared with men’s, particularly among single parents with children. Perhaps the most important is lower earnings, due in part to occupational segregation and the gender wage gap. Research indicates that closing the wage gap would significantly reduce poverty: if all working women aged 18 and older were paid the same as comparable men—men who are of the same age, have the same level of education, work the same number of hours, and have the same urban/rural status—the poverty rate for all working women would be cut in half, from 8.1 percent to 3.9 percent. The poverty rate for working single mothers would fall from 28.7 percent to 15.0 percent (Hartmann, Hayes, and Clark 2014). Other factors contributing to women’s poverty include unemployment, lack of work-family supports (Hess and Román forthcoming), the challenges of accessing public benefits (Waters, Boots 2010), and low benefit levels in many states (Huber, Kassabian, and Cohen 2014).
Poverty and Opportunity Among Millennial Women
Millennial women —defined here as those aged 16–34 in 2013—are a well-educated cohort who nonetheless face the challenges of managing student debt and relatively high rates of poverty.
- More than one in five millennial women (22.4 percent) lives below the poverty line, compared with one in six (16.8 percent) millennial men (Appendix Table B4.5). Millennial women’s poverty rate is higher than the rate for adult women overall. Millennial women are most likely to be poor if they live in Mississippi (33.9 percent), and least likely to be poor if they live in Maryland (14.0 percent). Millennial women are of childbearing age and supporting children on their own definitely contributes to their high poverty rate.
- Millennial women aged 25–34 are considerably more likely than millennial men of the same age range to have a bachelor’s degree or higher (36.3 percent compared with 28.3 percent). This difference between millennial women’s and men’s education is much larger than the difference between women and men overall (29.7 percent of women and 29.5 percent of men overall have a bachelor’s degree or higher).
- Among the 50 states and the District of Columbia, millennial women are the most likely to have at least a bachelor’s degree in the District of Columbia (71.3 percent), followed by Massachusetts (53.6 percent) and New York (46.6 percent; Appendix Table B4.5). Millennial women are the least likely to have a bachelor’s degree or higher in Nevada (24.5 percent), Mississippi (24.7 percent), and Arkansas (25.6 percent). In all states, millennial women are more likely than millennial men to have at least a bachelor’s degree, with the largest differences in Alaska (18.0 percentage points) and Vermont (16.6 percentage points).
- Many millennial women and men have substantial student debt. One study analyzing college affordability found that average undergraduate debt one year after graduation for students who have debt is higher for women than for men, among both those who have children and those who do not. For women with children, average debt is $29,452 compared with $26,181 for men with children; for women and men without children, average debt is $25,638 and $24,508, respectively (Gault, Reichlin, and Román 2014).
- Millennial women have higher rates of health insurance coverage than millennial men (79.2 percent compared with 72.8 percent), but lower rates of coverage than all nonelderly women and men. Coverage rates also vary among younger and older millennials: in the United States overall, women aged 16–25 (who under the ACA are allowed to stay on their parents’ health insurance plan; U.S. Department of Labor n.d.) are more likely to have coverage than those aged 26–34 (80.6 compared with 77.5 percent).
- Health insurance coverage for millennial women across the states ranged from a high of 95.2 in Massachusetts to a low of 67.8 percent in Texas in 2013, prior to the full implementation of health care exchanges under the ACA (Appendix Table B4.5).
- Rates of uninsurance among millennial women under age 25 decreased dramatically following implementation of the ACA. The percentage of women aged 18 to 24 without health insurance decreased by more than a third, from 24.9 percent to 15.9 percent (Martinez and Cohen 2009 and 2015).
Most data are based on IWPR analysis of American Community Survey microdata. Percent of millennial women and men with a bachelor’s degree or higher are three-year (2011–2013) averages; all other data are for 2013. Rates of uninsurance based on published data from the National Health Interview Survey data for 2008 and 2014.
Poverty and Opportunity Among Older Women
Older women (aged 65 and older) have lower socioeconomic status than older men due to multiple factors, including their more limited access to pensions and other sources of retirement income, lower lifetime earnings due to the gender wage gap (Hartmann and English 2009), and greater need for long-term care services at older ages (Kaiser Family Foundation 2013b).
- While younger women are much more likely than younger men to have a bachelor’s degree or higher, among older women and men the pattern differs: only 19.6 percent of women aged 65 and older have a bachelor’s degree or higher, compared with 29.9 percent of their male counterparts. Approximately 23.2 percent of women aged 65–74 have at least a bachelor’s degree, compared with 15.3 percent of women aged 75 and older (IWPR 2015a).
- Nearly all women and men aged 65 and older (99 percent) have health insurance coverage. One key source of coverage for older adults is Medicare, the federal health program that provides health insurance coverage to older Americans and younger adults with permanent disabilities (Kaiser Family Foundation 2013b and 2013c). Among women aged 65 and older with health insurance, the vast majority receive Medicare (97.6 percent). More than half (56 percent) of all Medicare recipients are women, and women are two-thirds of Medicare beneficiaries aged 85 and older (Kaiser Family Foundation 2013c).
- Among Medicare beneficiaries, older women have higher out-of-pocket annual expenses than older men, with the difference in expenses the largest among women and men aged 85 and older ($7,555 for women and $5,835 for men of this age range in 2009; Kaiser Family Foundation 2013c). These differences are due to women’s greater health care needs and use of long-term care services. On average, older women spend more than twice as much as older men for long-term services and supports (Kaiser Family Foundation 2013c).
- Older women (65 and older) are more likely to live in poverty than older men (11.3 percent compared with 7.4 percent; IWPR 2015a).
- Social Security provides an important economic base for older women that keeps many above poverty. In 2009, Social Security lifted more than 14 million women and men aged 65 and older above the poverty line; without Social Security’s programs, one-third of women in the United States aged 65–74 and half of women aged 75 and older would be poor (Hartmann, Hayes, and Drago 2011). Although Social Security’s benefits are relatively modest (the average monthly benefit for women aged 65 and older in the United States in 2013 was about $1,120; IWPR 2015d), Social Security’s programs provide more than three-fifths of total income for women aged 65 and older and more than half of all income for men of the same age range (Hartmann, Hayes, and Drago 2011). Social Security especially helps older women, whose longer life expectancy means that they often rely on the program for a longer period of time. In addition, older women are less likely to have income from their own pensions (either their own or a spouse’s or former spouse’s), and when they do have a pension plan they receive, on average, less than half as much as men (Hartmann, Hayes, and Drago 2011).
Data on poverty rates, educational attainment, and the percentage of older women and men with insurance coverage are based on IWPR analysis of 2013 American Community Survey microdata. Data on the average monthly amount of Social Security benefits for older women are based on IWPR calculations of data from the Social Security Administration.
Poverty and the Social Safety Net
Public programs such as Temporary Assistance for Needy Families (TANF), the Supplemental Nutrition Assistance Program (SNAP, formerly called food stamps), Medicaid, and the Earned Income Tax Credit (a federal tax credit aimed at offsetting federal income taxes for low-income working families and individuals) lessen the financial hardship many families face. Such programs, however, often fail to reach women and families who could benefit from their assistance. Nationally, more than one in three nonelderly women in poverty (35.4 percent) lacked health insurance coverage in 2013 (IWPR 2015a), and in 2012/2013 only 26 percent of families with children in poverty received TANF benefits (Center on Budget and Policy Priorities 2014). Limited access to these programs stems partly from complicated application and eligibility determination processes, lack of transportation and information about programs and how to enroll in them, and inconvenient appointment times to complete the application process (Waters, Boots 2010). In addition, even those who receive benefits may still experience several economic hardships, since benefit levels for these programs are often quite low (Huber, Kassabian, and Cohen 2014).
Poverty, Opportunity, and Economic Security Among Women Living with Same-Sex Partners
Lesbian, gay, bisexual, and transgender (LGBT) Americans have gained strong momentum in securing greater rights and societal acceptance in recent decades. As of February 2015, 37 states and the District of Columbia had authorized same-sex marriage (Human Rights Campaign 2015), the President of the United States had issued an executive order prohibiting discrimination based on sexual orientation and gender identity among federal contractors (The White House 2014), the Justice Department had expanded the interpretation of the Civil Rights Act of 1964 to protect against discrimination of transgender government employees (U.S. Department of Justice 2014), and the U.S. Equal Employment Opportunity Commission had chosen to interpret “sex discrimination” in Title VII to include discrimination based on sex or gender identity and begun accepting charges on those bases (U.S. Equal Opportunity Employment Commission n.d.). In addition, in 2013 the Supreme Court struck down parts of the Defense of Marriage Act (DOMA), clearing the way for same-sex spouses in states that recognize same-sex marriage to file joint tax returns, receive service member spousal benefits, sponsor a partner for U.S. residency, and qualify for the Family and Medical Leave Act (FMLA), among other benefits (Human Rights Campaign 2014a).
These changes point to significant progress, yet much remains to be done to extend basic legal protections to LGBT individuals. As of 2014, 29 states—mostly Midwestern, Mountain, and Southern states—still lacked statewide protections against employment discrimination based on sexual orientation and gender identity (Hasenbush et al. 2014).
- One study that analyzed four surveys—the National Survey of Family Growth (NSFG), General Social Survey (GSS), National Health Interview Survey (NHIS), and Gallup Daily Tracking Survey—found that across the surveys the proportion of adults in the United States who identify as LGBT ranged from 2.2 percent (in the NHIS) to 4.0 percent (in the Gallup data; Gates 2014a). Analysis of the Gallup data indicates that among those aged 18 and older, 4.1 percent of women and 3.9 percent of men identify as LGBT, with adults in the West (4.6 percent) and East (4.3 percent) more likely to identify as LGBT than those in the South (4.0 percent) and Midwest (3.8 percent; Gates 2014a).
- The same study shows that across the four surveys, younger adults are more likely to identify as LGBT than older adults (7.2 percent of adults aged 18–29 percent in the Gallup data compared with 2.1 percent of those aged 60 and older; Gates 2014a).
- Among adults aged 18 and older, a higher percentage of Hispanics (5.7 percent) and blacks (5.6 percent) identify as LGBT than Asians (4.4 percent) and whites (3.6 percent; Gates 2014a). Those who identify with another race or as multiracial are the most likely to identify as LGBT (6.5 percent).12
- The median annual earnings for women who live with a same-sex partner ($48,000) are considerably lower than those of men who live with a same-sex partner ($58,000) and lower than married men in different-sex households ($56,000), but higher than earnings for married women in different-sex households ($42,000) and women who live in a cohabiting relationship with a different sex partner ($33,000).13 14 Women living with a same-sex partner also have higher earnings than men cohabiting with a different-sex partner ($38,000).
- Women aged 16 and older who live with a same-sex partner are much more likely to participate in the labor force than women of the same age range who are married to men (74.8 percent compared with 60.0 percent). Women who live with a same-sex partner, however, are less likely to be in the workforce than unmarried women who live with a male partner (76.4 percent).
- Women who live with a same-sex partner are considerably more likely to hold a bachelor’s or advanced degree (43.7 percent) than married women in different-sex households (34.9 percent) and women who live with a different-sex partner (25.0 percent). Men who live with a same-sex partner are the most likely to hold at least a bachelor’s degree (48.5 percent).15
Despite their strong participation in the labor force, high earnings, and high educational levels, many women living with a same-sex partner experience economic insecurity.
- Women who live with a same-sex partner are more likely to live in poverty than women married to men (7.4 percent compared with 5.8 percent) and men living with a same-sex partner (3.5 percent). Single women and women who live with (but are not married to) a different-sex partner have much higher poverty rates at 24.5 and 13.1 percent, respectively.16
- Same-sex couples are 1.7 times more likely than different-sex couples to receive food stamps, with women, bisexuals, and people of color within the LGBT community among the most likely to be recipients (Gates 2014b). About one-third (34 percent) of LGBT women did not have enough money for food in a one year period between 2011 and 2012, compared with 20 percent of non-LGBT women and 24 percent of LGBT men. In addition, during this time 37 percent of black LGBT adults and 55 percent of Native Americans LGBT adults experienced food insecurity, compared with 23 percent of white LGBT adults (Gates 2014b).
- Rates of economic insecurity and discrimination within the transgender community are especially high. One study analyzing the National Transgender Discrimination Survey found that transgender adults were nearly four times more likely than adults in the general population to have a household income below $10,000 and twice as likely to be unemployed. In addition, almost one in five (19 percent) had experienced homelessness. Ninety percent of survey respondents reported having experienced harassment or mistreatment in the workplace, and 47 percent said they have experienced an adverse job outcome, such as being fired, not hired, or denied a promotion (Grant, Mottet, and Tanis 2011).
- The percentage of LGBT Americans lacking health insurance coverage has decreased substantially since the Affordable Care Act’s provisions mandating health insurance went into effect in 2014. Still, LGBT Americans are less likely to be insured than their non-LGBT counterparts. Approximately 18 percent of LGBT adults aged 18 and older report not having health insurance, compared with 13 percent of non-LGBT adults (Gates 2014c).
- LGBT women are significantly more likely than non-LGBT women to report not having enough money to pay for health care or medicine (29 percent compared with 19 percent), and not having a personal doctor (29 percent compared with 16 percent; Gates 2014c).
These findings underlie the need to increase legal protections for LGBT individuals, eliminate discrimination, and foster acceptance of diverse gender identities and expressions.
Data on earnings, labor force participation, educational attainment, and poverty are based on IWPR analysis of 2013 American Community Survey microdata.
Poverty and Opportunity Among Immigrant Women
Immigrant women in the United States are a diverse group with varied levels of education and access to resources and supports.17
- More than one in four immigrant women in the United States (27.9 percent) holds a bachelor’s or advanced degree, compared with 30.0 percent of U.S.-born women. Among the ten largest sending countries for female immigrants—Mexico, the Philippines, China, India, Vietnam, Korea, El Salvador, Cuba, the Dominican Republic, and Canada—immigrant women from India (71.8 percent), the Philippines (51.4 percent), and Korea (46.1 percent) are the most likely to have a bachelor’s degree or higher (IWPR 2015a). Some immigrant women who have college degrees, however, find that their qualifications are not recognized in this country and can find only low-skilled, low-paying jobs (Redstone Akresh 2006).
- While a substantial share of immigrant women hold bachelor’s degrees, three in ten (29.6 percent) have less than a high school diploma. Among the ten largest sending countries, women from Mexico and El Salvador are the most likely to have less than a high school diploma (57.3 and 52.7 percent, respectively). Immigrant women from the Philippines and Canada are the least likely to lack a high school diploma (8.6 and 9.4 percent).
- Immigrant women are more likely than U.S.-born women to live in poverty (19.7 percent compared with 14.7 percent). Among the ten largest sending countries, immigrant women from the Dominican Republic (30.3 percent), Mexico (30.0 percent), Cuba (22.6 percent), and El Salvador (20.8 percent) have the highest poverty rates. Immigrant women from India (5.7 percent), the Philippines (6.9 percent), and Canada (11.1 percent) have the lowest poverty rates.
- Immigrant women are significantly less likely to have health insurance coverage than U.S.-born women (66.3 percent of immigrant women aged 18–64 compared with 84.6 percent of U.S.-born women of the same age range). Immigrants face multiple barriers in accessing basic health coverage, including a federal law that bans many immigrants from means-tested benefit programs such as Medicaid in their first five years of legal status (Broder and Blazer 2011; National Immigration Law Center 2014).18 In Medicaid and Children’s Health Insurance Program (CHIP), states may waive the five-year waiting period for children and pregnant women who are lawfully residing in the United States. As of January 2015, 27 states and the District of Columbia covered otherwise eligible immigrant children to some extent under this option, and 22 states and the District of Columbia covered otherwise eligible pregnant women (Kaiser Family Foundation 2015b). The Affordable Care Act also permits immigrants who are ineligible for Medicaid due to the five-year ban to buy private insurance through the insurance exchanges and receive subsidies (Hasstedt 2013).
- The percentage of immigrant women from the top ten sending countries who have health insurance varies widely. Mexican and Salvadoran immigrant women are the least likely to have coverage (only 44.0 percent and 51.5 percent, respectively). Canadian and Indian women are the most likely to have coverage (89.6 percent and 88.1 percent have health insurance, respectively).
Data on poverty rates, educational attainment, and health insurance are based on IWPR analysis of 2013 American Community Survey microdata.
Increasing women’s access to resources that foster their economic independence and success is integral to the overall well-being of women, families, and communities. Women have made great gains in education in recent years and are a driving force behind the nation’s growth in businesses and the revenues they generate, yet many women lack economic security and do not have the opportunity to pursue the education and training that might put them on a path to increased financial stability. In addition, women continue to face significant racial and ethnic disparities, and access to public benefits that serve as an important source of support is often limited. Women’s access to the resources that enable economic independence varies across states; pinpointing these differences and increasing supports that help women to thrive in the workforce and beyond is essential to elevating women’s status.
Methodology
Appendix Tables
Table B4.1. State-by-State Data and Rankings on Poverty and Opportunity Among Men
Table B4.2. Data on Poverty and Opportunity by Gender and Race/Ethnicity, United States, 2013
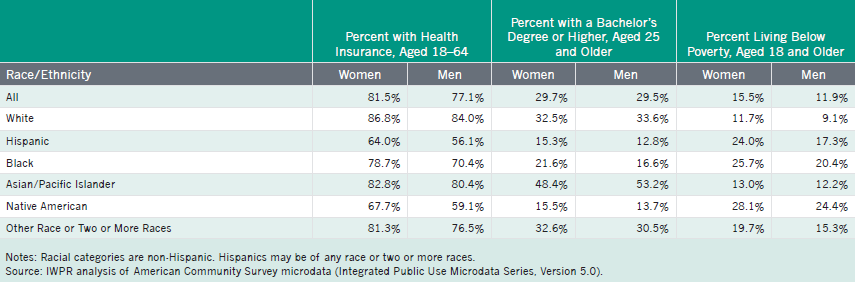
Table B4.3. Data and Rankings on Poverty and Opportunity Among Women by Detailed Racial and Ethnic Groups, United States, 2013
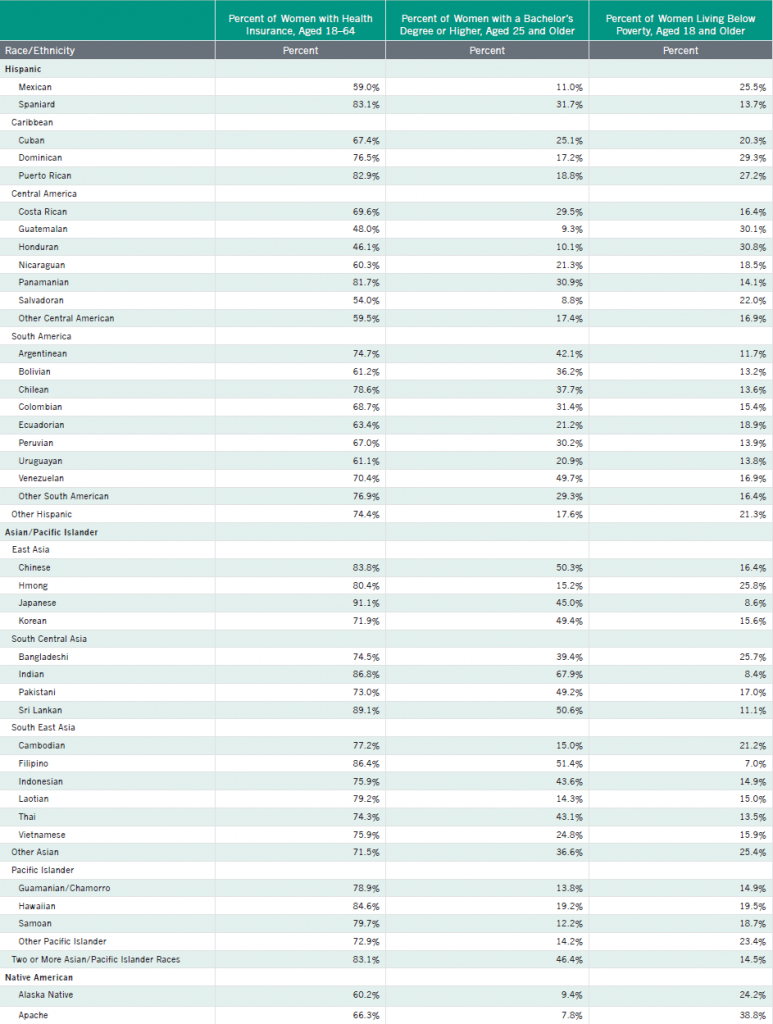
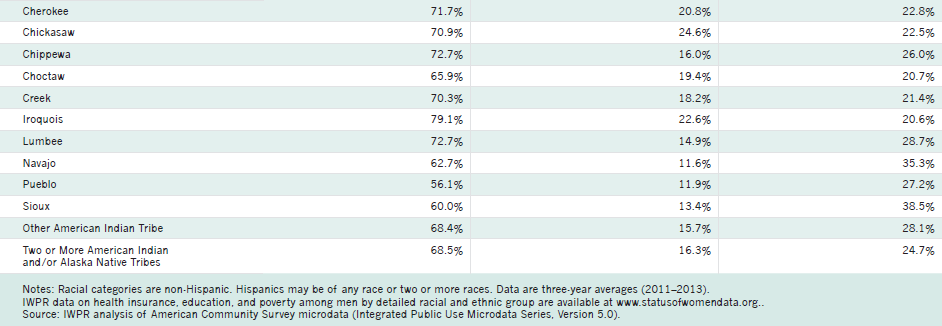
Table B4.4. Women’s Highest Level of Educational Attainment by State, 2013
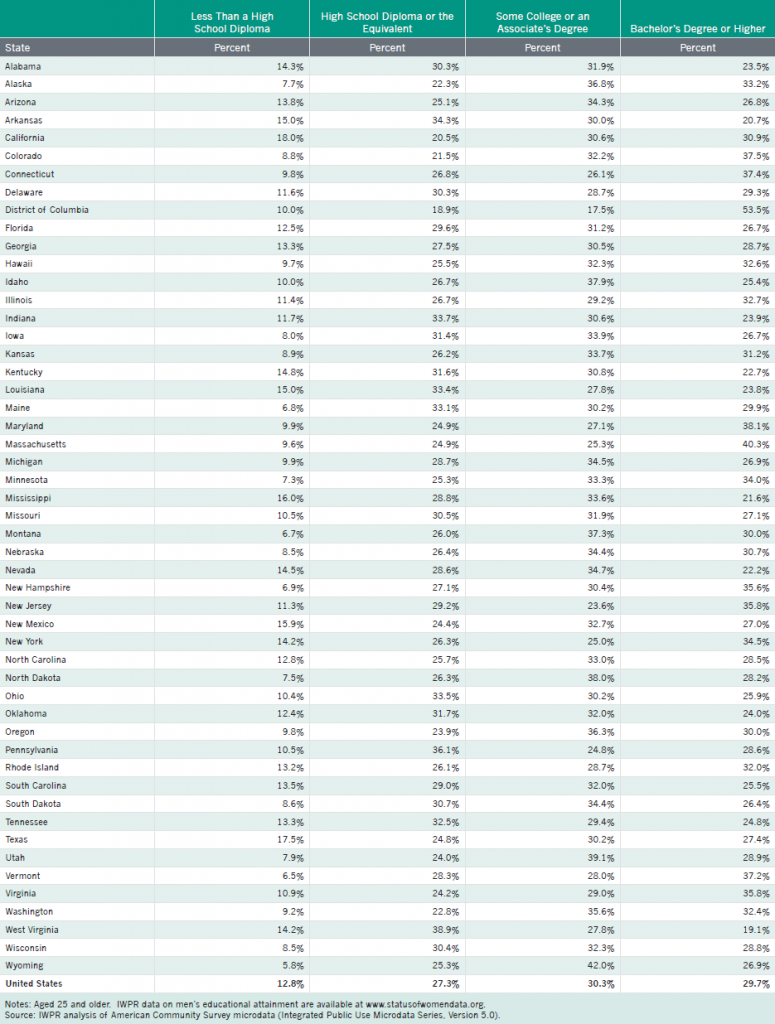
Table B4.5. Poverty and Opportunity Among Young Women and Men by State, 2013
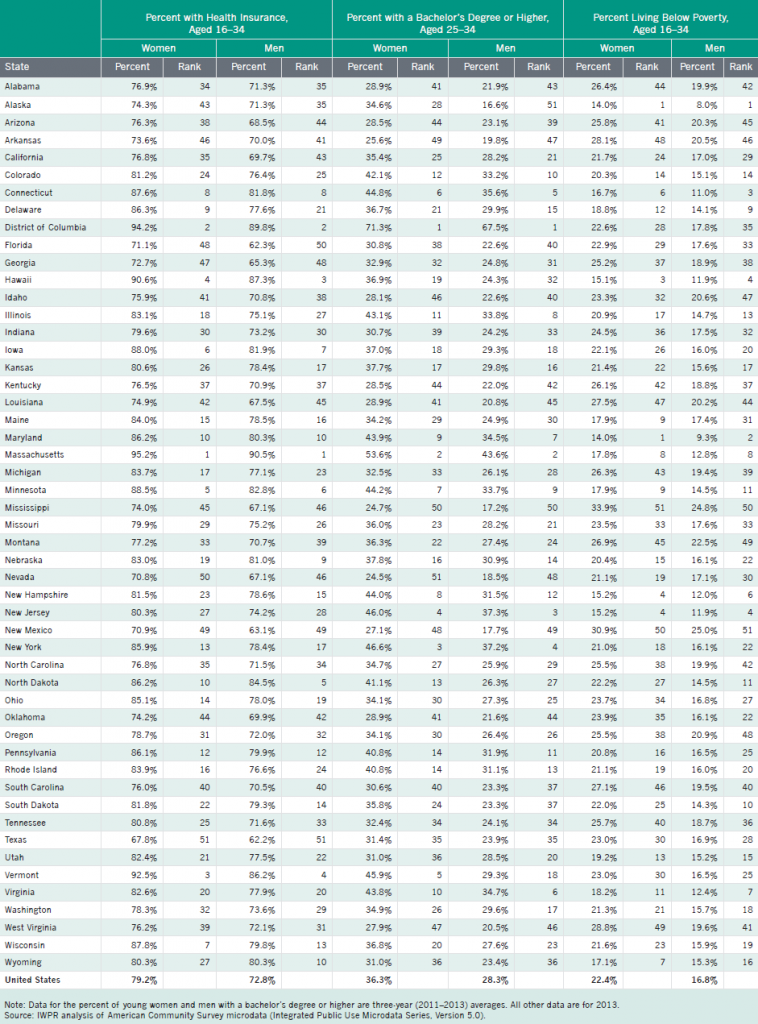
Table B4.6. Percent of Households Below Poverty by Household Type and State, 2013
Notes
1In IWPR’s previous national Status of Women in the States reports, this area of women’s status was called “Social and Economic Autonomy.”
2This poverty estimate for 2013 is based on IWPR calculations of data from the Current Population Survey (CPS) Annual Social and Economic Supplement (the official annual measure of poverty in the United States). These data are published by the Census Bureau (U.S. Department of Commerce 2014a) and are for the population aged 18 and older. IWPR’s estimate in the 2004 data release is based on analysis of CPS data and is for the population aged 16 and older. Elsewhere in this report, IWPR relies primarily on the American Community Survey (ACS) for analyzing women’s poverty status, since the ACS’s larger sample sizes make it possible to provide data disaggregated by age and race/ethnicity at the state level. Based on analysis of 2013 ACS microdata, IWPR estimates the poverty rate to be 15.5 percent for women aged 18 and older in the United States, and 11.9 percent for men of the same age range. See Appendix A for a summary of the differences between the ACS and CPS.
3Not all types of health insurance coverage are listed. People may have more than one type of insurance.
4Federal law allows for the expansion of Medicaid to individuals with incomes at or below 133 percent of the federal poverty line. The law also includes a five percent “income disregard,” which effectively makes the limit 138 percent of poverty (Center for Mississippi Health Policy 2012).
5Health insurance is calculated for all workers and not controlled for age, level of education, or industry of employment; when controlling for these factors, the union advantage is smaller but still strong (Jones, Schmitt, and Woo 2014).
6These majors are petroleum engineering, pharmaceutical sciences and administration, chemical engineering, aerospace engineering, electrical engineering, engineering and industrial management, naval architecture and marine engineering, environmental engineering, metallurgical engineering, and mechanical engineering.
7These majors are pharmaceutical sciences and administration, information sciences, chemical engineering, computer science, electrical engineering, mechanical engineering, industrial and manufacturing engineering, computer engineering, business economics, and civil engineering.
8Data include both part-time and full-time workers.
9Some cash benefits or cash-like assistance (e.g., the Earned Income Tax Credit and food nutrition assistance) are not counted as income when the Census Bureau calculates the official poverty rate (Fremstad 2010).
10The Self-Sufficiency Standard developed by Wider Opportunities for Women attempts to address the inadequacy of the official poverty measure by calculating the amount of money required to support families of various sizes without private or informal assistance in different states across the nation. This standard is adjusted for the cost of living in different counties and accounts for basic costs incurred by working families, including housing, child care, food, health care, transportation, taxes and tax credits, and miscellaneous items. As of 2015, the Standard had been developed for 37 states and the District of Columbia (Center for Women’s Welfare 2015).
11It is difficult to calculate the SPM at the state level using American Community Survey data (Short 2014), since calculations of the SPM would require additional data beyond the data collected in the ACS (e.g., data on medical out-of-pocket expenditures and work expenses). For this reason, the state poverty estimates in this report are based only on the official poverty measure.
12Figures are based on analysis of Gallup data (Gates 2014a).
13Due to sample size limitations, data on women living with same-sex partners includes both those who are married and those who are not married.
14Earnings data are for full-time, year-round workers aged 16 and older.
15Percent of those with a bachelor’s degree or higher includes those aged 25 and older.
16Poverty rates are for those aged 18 and older.
17Immigrant women are those born outside the United States who were not U.S. citizens at birth. As Singer, Wilson, and DeRenzis (2009) observe, this includes legal permanent residents, naturalized citizens, refugees, asylum seekers, and migrants who temporarily stay in the United States. It also includes some undocumented immigrants, although this population may be undercounted by Census survey data. The term U.S.-born refers to individuals born in the United States or abroad to American parents.
18Refugees and certain other humanitarian immigrants are not subject to this bar (Broder and Blazer 2011). There are also other exceptions to these restrictions; for example, in SNAP, the five-year waiting period is waived for children who are legal permanent residents or have certain other lawful immigration statuses (U.S. Department of Agriculture 2014).Under federal law, undocumented immigrants are generally ineligible for all public benefits, with a few exceptions (National Immigration Law Center 2014).