In this Section
The Reproductive Rights Composite Score
Trends in Women’s Reproductive Rights
The Affordable Care Act and Contraceptive Coverage
Medicaid Expansion and State Medicaid Family Planning Eligibility Expansions
Other Family Planning Policies and Resources
- Access to Fertility Treatments
- Mandatory Sex Education in Schools
- Same-Sex Marriage and Second-Parent Adoption
Fertility, Natality, and Infant Health
Introduction
Reproductive rights—having the ability to decide whether and when to have children—are important to women’s socioeconomic well-being and overall health. Research suggests that being able to make decisions about one’s own reproductive life and the timing of one’s entry into parenthood is associated with greater relationship stability and satisfaction (National Campaign to Prevent Teen and Unplanned Pregnancy 2008), more work experience among women (Buckles 2008), and increased wages and average career earnings (Miller 2011). In addition, the ability to control the timing and size of one’s family can have a significant effect on whether a young woman attends and completes college (Buckles 2008; Hock 2007). Given that a postsecondary degree considerably increases earnings (Gault, Reichlin, and Román 2014), the ability to make family planning choices could mean the difference between women being stuck at poverty-level wages or achieving long-term financial security.
In recent years, policies affecting women’s reproductive rights in the United States have substantially changed at both the federal and state levels. The 2010 Patient Protection and Affordable Care Act (ACA) increased access to preventive women’s health services and contraceptive methods and counseling for millions of women (Burke and Simmons 2014), and facilitated states’ ability to expand Medicaid family planning services. At the same time, legal limitations to women’s reproductive rights have increased in states across the country, making it harder for women to access the reproductive health services and information they need (Guttmacher Institute 2015a; NARAL Pro-Choice America and NARAL Pro-Choice America Foundation 2015). In the first quarter of 2015 alone, state legislators introduced a total of 332 provisions to restrict access to abortion services; by April 2015, 53 of these provisions had been approved by a legislative chamber and nine had been enacted (Guttmacher Institute 2015a).
This report provides information on a range of policies related to women’s reproductive health and rights. It examines abortion, contraception, the access of individuals in same-sex couples to full parental rights, infertility, and sex education. It also presents data on fertility and natality—including infant mortality—and highlights disparities in women’s reproductive rights by race and ethnicity. In addition, the report examines recent shifts in federal and state policies related to reproductive rights. It explores the decision of some states to expand Medicaid coverage under the ACA, as well as state policies to extend eligibility for Medicaid family planning services. It also reviews the recognition of same-sex marriage in a growing majority of states across the nation (National Center for Lesbian Rights 2015)—a change that has profound implications for the ability of same-sex couples to create the families they desire.
The Reproductive Rights Composite Score
Best and Worst States on Women’s Reproductive Rights
| State | Rank | Grade | State | Rank | Grade | ||
| Oregon | 1 | A- | South Dakota | 51 | F | ||
| Vermont | 2 | A- | Nebraska | 50 | F | ||
| Maryland | 3 | A- | Kansas | 49 | F | ||
| New Jersey | 4 | A- | Idaho | 48 | F | ||
| Hawaii | 5 | A- | Tennessee | 47 | D- | ||
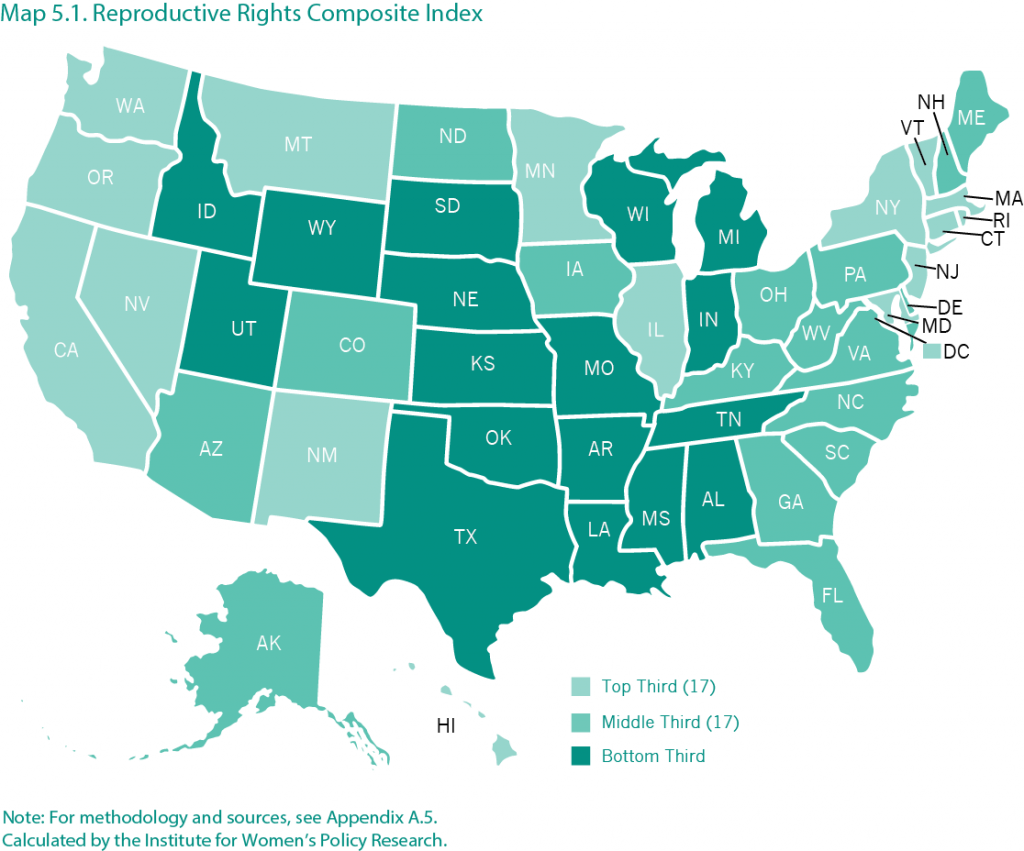
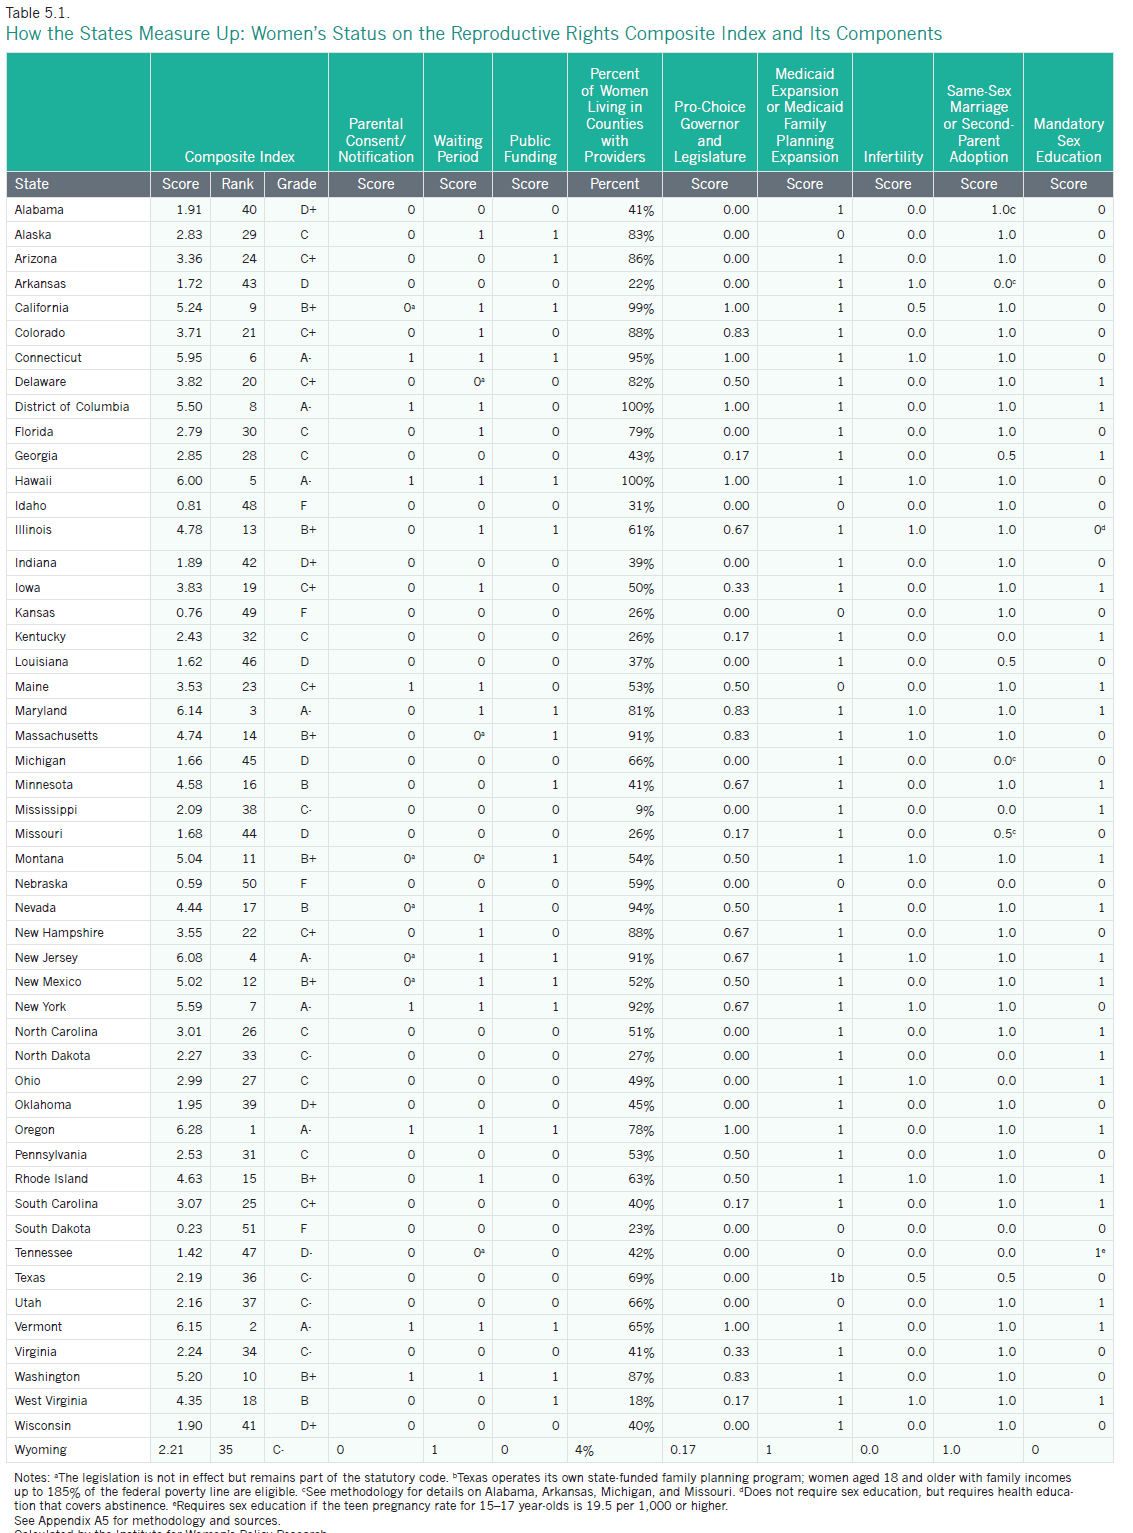
The reproductive rights composite index includes nine component indicators of women’s reproductive rights: mandatory parental consent or notification laws for minors receiving abortions, waiting periods for abortions, restrictions on public funding for abortions, the percent of women living in counties with at least one abortion provider, pro-choice governors or legislatures, Medicaid expansion or state Medicaid family planning eligibility expansions, coverage of infertility treatments, same-sex marriage or second-parent adoption for individuals in a same-sex relationship, and mandatory sex education. States receive composite scores and corresponding grades based on their combined performance on these indicators, with higher scores reflecting a stronger performance and receiving higher letter grades (Table 5.1). For information on how composite scores and grades were determined, see methodology.
- Oregon has the highest score on the composite reproductive rights index. It does not require parental consent or notification or waiting periods for abortion; provides public funding to poor women for abortion; has 78 percent of women living in counties with abortion providers; has a pro-choice Governor, Senate, and House of Representatives; has adopted the expansion of Medicaid coverage under the ACA of up to 138 percent of the federal poverty line and enacted a state Medicaid family planning eligibility expansion; recognizes same-sex marriage; and requires schools to provide sex education. Oregon does not, however, require insurance companies to cover infertility treatments. The state’s top ranking is a substantial improvement since the 2004 Status of Women in the States report, when it ranked 19th in the nation.
- The worst-ranking state for reproductive rights is South Dakota. It requires parental consent or notification and waiting periods for abortion, does not provide public funding to poor women for abortion, has just 23 percent of women living in counties with abortion providers, does not have a pro-choice state government, has not adopted the overall Medicaid expansion or expanded eligibility for Medicaid family planning services, does not require insurance companies to cover infertility treatments, does not recognize same-sex marriage or allow second-parent adoption for same-sex couples, and does not require schools to provide mandatory sex education. In the 2004 Status of Women in the States report, South Dakota ranked second to last.
- In general, reproductive rights are strongest in the Mid-Atlantic region, New England, and the West. In addition to Oregon, the top ten jurisdictions include California, Connecticut, the District of Columbia, Hawaii, Maryland, New Jersey, New York, Vermont, and Washington.
- The South and Midwest fare the worst on the reproductive rights composite index. In addition to South Dakota, five Midwestern states—Indiana, Kansas, Michigan, Missouri, and Nebraska—are among the ten lowest-ranking states. Three Southern states are also a part of this group: Arkansas, Louisiana, and Tennessee. Idaho also ranks in the bottom ten.
- The top grade for reproductive rights is an A-, which was awarded to the District of Columbia and seven states: Connecticut, Hawaii, Maryland, New Jersey, New York, Oregon, and Vermont. The four lowest-ranking states—South Dakota, Nebraska, Kansas, and Idaho —all received an F (for information on how grades were determined, see methodology).
Trends in Women’s Reproductive Rights
Between the publication of the 2004 Status of Women in the States report and this report, states overall made nominal progress on two indicators and declined or stayed the same on five others.1
What Has Improved
- In October 2014, 12 states required insurance companies to provide coverage of infertility treatments, compared with just nine states in 2004. The number of states that required insurance companies to offer policyholders at least one package with coverage of infertility treatments, however, declined from five states in 2004 to two in 2014 (IWPR 2004; National Conference of State Legislatures 2014).
- Between 2004 and 2015, the percentage of women living in counties with at least one abortion provider declined in 22 states, increased in 24 states, and stayed the same in four states and the District of Columbia (IWPR 2004; Table 5.1).
What Has Worsened or Stayed the Same
- In 2015, 30 states had statutes requiring waiting periods for abortions—which mandate that a physician cannot perform an abortion until a certain number of hours after the patient is notified of her options in dealing with a pregnancy—compared with 26 states in 2004 (Table 5.1; IWPR 2004).2
- Between 2004 and 2015, the share of public officials—including the Governor (or mayor for the District of Columbia) and state legislators (or city council members for the District of Columbia)—who were pro-choice increased in 14 states and decreased in 22 states. The share of pro-choice officials stayed the same in the other 14 states and the District of Columbia (IWPR 2004; Table 5.1).
- The number of jurisdictions with laws on the books preventing minors from accessing abortion without parental consent or notification (43) stayed the same between 2004 and 2015 (Guttmacher Institute 2004a; Table 5.1).
- The number of states (17) that provide public funding for all or most medically necessary abortions—typically defined to protect the woman’s physical or mental health (Kaiser Family Foundation 2014b)—for Medicaid enrollees stayed the same between 2004 and 2015 (Guttmacher Institute 2004b; Table 5.1).
- Between 2004 and 2015, the number of jurisdictions that required schools to provide mandatory sex education (23) remained the same (Guttmacher Institute 2004c; Table 5.1).
Access to Abortion
In the United States, the 1973 Supreme Court case Roe v. Wade established the legal right to abortion. State legislative and executive bodies nonetheless continue to battle over legislation related to access to abortion, including parental consent and notification and mandatory waiting periods (Guttmacher Institute 2015b). In addition, public funding for abortion remains a contested issue in many states: federal law has banned the use of federal funds for most abortions since 1977, and currently does not allow the use of federal funds for abortion unless the pregnancy resulted from rape or incest or the woman’s life is in danger (Boonstra 2013). The Affordable Care Act of 2010 reinforces these restrictions, but state Medicaid programs have the option to cover abortion in other circumstances using only state and no federal funds (Salganicoff et al. 2014).
State legislative efforts to limit access to abortion have become commonplace. In 2013 and 2014, a broad range of legislation was introduced and passed, including bills requiring women to have an ultrasound before obtaining an abortion, stringent regulatory measures targeting abortion providers, bans or restrictions preventing women from obtaining health insurance coverage for abortion, and bans on abortion at later stages of pregnancy (National Women’s Law Center 2014a and 2014b).
- Twenty-six of the 30 states that as of March 2015 had statutes requiring mandatory waiting periods for obtaining an abortion enforced these statutes, with waiting periods that ranged from 18 to 72 hours (Guttmacher Institute 2015b). In Delaware, Massachusetts, Montana, and Tennessee, the legislation remained part of the statutory code but was not enforced.
- As of March 2015, 43 states had parental consent or notification laws—which require parents of a minor seeking an abortion to consent to the procedure or be notified—and 38 of the 43 enforced these laws. Among these 38 states, 12 enforced the notification of parents and 21 enforced parental consent. Five states—Oklahoma, Texas, Utah, Virginia, and Wyoming—enforced both parental consent and notification for minors seeking to undergo an abortion procedure (Guttmacher Institute 2015b).
- Seventeen states as of March 2015 fund abortions for low-income women who were eligible for Medicaid in all or most medically necessary circumstances. In 27 states and the District of Columbia, state funding for abortions is available only in situations where the women’s life is in danger or the pregnancy resulted from rape or incest (Guttmacher Institute 2015b). In five states—Indiana, Mississippi, Utah, Virginia, and Wisconsin—state Medicaid funds can be used to pay for abortions in situations where the woman’s life is endangered, when the pregnancy resulted from rape or incest, or when there is a threat to the woman’s physical health or a fetal anomaly. In South Dakota, state Medicaid funds can be used to pay for abortions only when the woman’s life is endangered (Guttmacher Institute 2015b).
- As of 2011—the most recent year for which data are available—the percentage of women aged 15–44 who lived in counties with an abortion provider ranged across states from a low of four percent in Wyoming to a high of 100 percent in the District of Columbia and Hawaii. In the bottom five states—Wyoming, Mississippi, West Virginia, Arkansas, and South Dakota—fewer than one in four women lived in counties with at least one provider. In the top eight jurisdictions—the District of Columbia, Hawaii, California, Connecticut, Nevada, New York, New Jersey, and Massachusetts—more than 90 percent of women lived in counties with at least one abortion provider (Guttmacher Institute 2014).
- As of December 2014, the governor and majority of state legislators in 21 states were anti-choice (NARAL Pro-Choice America and NARAL Pro-Choice America Foundation 2015). In six jurisdictions—including California, Connecticut, the District of Columbia, Hawaii, Oregon, and Vermont—the governor (or in the case of the District of Columbia, the mayor) and the majority of legislators (city council for the District of Columbia) were pro-choice and would not support restrictions on abortion rights. In the remaining states, the government was mixed.
The Affordable Care Act and Contraceptive Coverage
The 2010 Patient Protection and Affordable Care Act (ACA) has expanded women’s access to contraception in several ways, including by requiring health care insurers to cover contraceptive counseling and services and all FDA-approved contraceptive methods without any out-of-pocket costs to patients (U.S. Department of Health and Human Services 2014). This change is particularly significant for lower-income women who often struggle with the financial burden associated with purchasing contraception on a regular basis (Center for Reproductive Rights 2012). According to the Guttmacher Institute, the average cost of a year’s supply of birth control pills is the equivalent of 51 hours of work for a woman making the federal minimum wage of $7.25 an hour (Sonfield 2014). One national study estimates that for uninsured women, the average cost of these pills over a year ($370) is 68 percent of their annual out-of-pocket expenditures for health care services (Liang, Grossman, and Phillips 2011).
Prior to the ACA, state contraceptive equity laws were the only legal protections ensuring that women could access affordable contraceptives as easily as they could other prescription drugs (Guttmacher Institute 2015c). These laws required state-regulated plans providing coverage for prescription medications to do the same for contraceptive drugs and devices (National Women’s Law Center 2012). Only 28 states, however, required full or partial contraceptive coverage; the remaining states and the District of Columbia had no such legal protection safeguarding access to affordable contraception (Guttmacher Institute 2015c). The ACA has significantly increased the proportion of women who have access to contraception at no cost: one study focusing on about 900 women who had private health insurance and used a prescription contraceptive method found that between the fall of 2012 (before the ACA’s contraceptive coverage requirement took effect for most women) and the spring of 2014, the percentage of women paying zero dollars out of pocket for oral contraception increased from 15 to 67 percent (Sonfield et al. 2015).
The ACA’s contraceptive requirement, however, has some notable exceptions. Some religious organizations, such as churches and other houses of worship, are exempt from the requirement to include birth control in their health insurance plans (National Women’s Law Center 2015). An “accommodation” is also available to religiously-affiliated nonprofit organizations that certify their religious objections to the health insurance carrier or third party administrator, or notify the Department of Health and Human Services of their objection; those who qualify for the accommodation do not have to cover contraceptives for their female employees, but these employees can still get birth control coverage directly from the insurance company (National Women’s Law Center 2015; Sobel, Salganicoff, and Kurani 2015). In addition, “grandfathered” health plans that existed prior to the ACA are temporarily exempt from the requirement to provide contraceptive coverage through employer-sponsored health plans, except in states with a contraceptive equity law that already requires coverage (although contraceptive equity laws do not require insurers to provide contraceptive coverage without cost sharing; National Women’s Law Center 2012).3 A Supreme Court decision, Burwell v. Hobby Lobby Stores, Inc., has also expanded allowable exemptions to certain family-owned, “closely held” corporations with religious objections to contraception (Dreweke 2014; National Women’s Law Center 2015). The ruling does not supersede state contraceptive equity laws, but it does mean that employees of firms such as Hobby Lobby, which self-insures its employees and therefore is subject only to federal law, may lose their coverage of contraceptive drugs and services (Rovner 2014).
While the ACA expands access to contraception for many women, some have expressed concern that insurance-related delays in access or denials of a preferred method of contraception may undermine the law’s intent to eliminate barriers to all FDA-approved methods of contraception (Armstrong 2013). Insurers often use “medical management techniques”—such as limiting quantity and/or supply or requiring provider authorization before providing a drug or service—that can deter patients from using certain services and shape the course of treatment. While such practices, in some circumstances, can improve efficiency and save costs, they can also prevent or delay access to services. When insurers adopt practices that limit women’s options for contraception, some women may be left without access to the method that works best for them (Armstrong 2013). One recent report that reviewed the insurance plan coverage policies of 20 insurance carriers in five states found that while most carriers are complying with the ACA’s contraceptive provision, there exists some variation in how the guidelines for contraceptive coverage issued by the U.S. Department of Health and Human Services are interpreted; as a result, not all carriers cover all contraceptive methods without cost-sharing (Sobel, Salganicoff, and Kurani 2015). To help ensure that women have access to the full range of contraceptive methods without cost-sharing, the state of California passed a post-ACA contraceptive coverage law (SB 1053) that limits medical management as applied to contraception and goes beyond federal law in prohibiting non-grandfathered and Medi-Cal plans from instituting cost-sharing requirements or imposing restrictions or delays in providing contraceptive benefits (Sobel, Salganicoff, and Kurani 2015).
Emergency Contraception
Emergency contraception—birth control that can be taken up to several days after unprotected sex, contraceptive failure, or sexual assault—can prevent unwanted pregnancies and allow women to maintain control over the timing and size of their families. Plan B—approved for use in the United States in 1999—was the first oral form of emergency contraception to be available, but others were subsequently introduced (Kaiser Family Foundation 2014c). The Affordable Care Act’s contraceptive provision that requires all new private health plans to cover all contraceptive drugs and devices prescribed to patients without cost-sharing includes emergency contraception (Kaiser Family Foundation 2014c).
State legislatures have taken different approaches to addressing the issue of emergency contraception. Some have sought to restrict access by excluding it from state Medicaid family planning eligibility expansions or contraceptive coverage mandates, or by allowing some pharmacists or pharmacies to refuse to provide contraceptive services (Guttmacher Institute 2015d). Others have expanded access by requiring emergency rooms to provide information about emergency contraception to sexual assault victims, requiring emergency rooms to dispense emergency contraception to sexual assault victims who request it, allowing women to obtain emergency contraception without a doctor’s prescription, or directing pharmacies or pharmacists to fill all valid prescriptions (Guttmacher Institute 2015d). Public health and educational initiatives have led to an increase in awareness and use of emergency contraception (Kaiser Family Foundation 2014c); one study that analyzed data from the National Survey of Family Growth found that in 2006–2010, 11 percent of sexually experienced women aged 15 to 44 reported having ever used emergency contraception pills, compared with 4 percent in 2002 (Daniels, Jones, and Abma 2013).
Still, women continue to encounter barriers to accessing emergency contraception. For example, although most women have heard of emergency contraception, some are not aware of its existence (Kaiser Family Foundation 2014c), In addition, federal law requires women of all ages to have a prescription to obtain ella, the most effective form of emergency contraception for women who are overweight or obese; Plan B and generic forms of emergency contraception can be purchased over-the-counter (Kaiser Family Foundation 2014c). Another barrier is that health care providers also do not always discuss emergency contraception with women in clinical settings, leaving some women without the information they need (Kaiser Family Foundation 2014c). One study of 180 pharmacies in 29 states also found that progestin-based EC pills are often not stocked on store shelves or held behind the counter due to their high cost (American Society for Emergency Contraception 2014).
Native American Women and Emergency Contraception
Research indicates that for many Native American women, emergency contraception may be particularly difficult to access. This lack of access represents a serious concern for indigenous communities, especially given that Native American women experience higher levels of sexual assault than women of other races and ethnicities (Breiding et al. 2014; Kingfisher, Asetoyer, and Provost 2012). One study that surveyed 40 Indian Health Service (IHS) pharmacies found that only 10 percent had Plan B available over the counter; at 37.5 percent of the pharmacies surveyed, an alternative form of emergency contraception was offered, and the rest had no emergency contraception at all (Gattozzi 2008; Asetoyer, Luluquisen, and Millis 2009). Many Native American women who live on reservations face significant barriers to accessing emergency contraception through a commercial pharmacy outside of their reservation (Kingfisher, Asetoyer, and Provost 2012), including geographic constraints (having to travel a great distance to find a pharmacy that provides emergency contraception) and financial obstacles. Expanding access to emergency contraception for Native American women and others who may lack access is integral to improving women’s overall well-being and securing their reproductive rights.
Medicaid Expansion and State Medicaid Family Planning Eligibility Expansions
In addition to requiring most health insurers to cover contraceptive counseling and services and all FDA-approved contraceptive methods, the Affordable Care Act has increased women’s access to contraception by expanding the number of people who have health insurance coverage. The ACA has dramatically reduced rates of uninsurance among women aged 18 to 24 by allowing adult children to stay on their parents’ health insurance plans until the age of 26; between 2008 and 2014, the percentage of women aged 18 to 24 without health insurance decreased from 24.9 to 15.9 percent. During this time period, uninsurance rates for women of all ages dropped about 18 percent, from 13.0 percent of women lacking insurance in 2008 to 10.6 percent in the first nine months of 2014 (Martinez and Cohen 2009 and 2015). Complete data reflecting changes in health insurance for women following the ACA are not yet available.
The ACA has also increased the number of people with health insurance through changes to Medicaid, a public health coverage program for low-income individuals. To help those who may have struggled in the past to afford insurance, the ACA seeks to expand Medicaid eligibility to all individuals under age 65 who are not eligible for Medicare and have incomes up to 138 percent of the federal poverty line (individuals were previously eligible only if they were pregnant, the parent of a dependent child, 65 years of age or older, or disabled, in addition to meeting income requirements; the National Conference of State Legislatures 2011).4 This change increases the number of women who are eligible to receive family planning services, along with other health care services; however, states can opt out of this Medicaid expansion. As of April 2015, 29 states and the District of Columbia had chosen to adopt the Medicaid expansion, and five were in the process of deciding whether to do so (Kaiser Family Foundation 2015).
In addition to the overall Medicaid expansion, the ACA provides states with a new pathway to expand eligibility for family planning coverage through changes to their state Medicaid program. Before the ACA, states could expand their programs by obtaining a waiver of federal policy from the Centers for Medicare and Medicaid Services (Guttmacher Institute 2015e). States interested in expanding family planning through Medicaid can now either complete the process through a waiver from the federal government (which is a temporary solution), or through an expedited option of a State Plan Amendment, which is a permanent change to the state’s Medicaid program (Guttmacher Institute 2015e).
- As of April 2015, 28 states had extended family planning services to individuals who are otherwise ineligible, either through a waiver or through a State Plan Amendment (including Texas, which had an expansion funded solely by the state). The income ceiling among states that have expanded their programs ranged from a low of 105 percent of the federal poverty line in Virginia (where the expansion includes those losing postpartum coverage) to a high of 306 percent of the federal poverty line in Wisconsin (Guttmacher Institute 2015e).
- Of the 28 states that expanded eligibility for family planning services through Medicaid, 25 states provided family planning benefits to individuals based on income, with most of these states having an income ceiling at or near 200 percent of the federal poverty line. One state (Florida) provided these benefits to women who lose Medicaid coverage for any reason, rather than basing eligibility only on income, and Rhode Island and Wyoming provided them only if a woman loses coverage postpartum (Guttmacher Institute 2015e).
- Twenty states defined the eligible population for Medicaid coverage of family planning services to include individuals who are younger than 19 years old. Three states—Georgia, Missouri, and Pennsylvania—included individuals who are 18 years old but not those who are younger than 18 (Guttmacher Institute 2015e).
- As of April 2015, 16 states had both expanded Medicaid overall and expanded Medicaid family planning eligibility (Guttmacher Institute 2015e; Kaiser Family Foundation 2015). Fourteen states and the District of Columbia had expanded Medicaid overall but did not have a family planning eligibility expansion, and 13 states had enacted a family planning expansion but had not adopted the Medicaid expansion. Eight states—Alaska, Idaho, Kansas, Maine, Nebraska, South Dakota, Tennessee, and Utah—had neither expanded Medicaid overall nor enacted a state family planning expansion (Table 5.1).
Other Family Planning Policies and Resources
Access to Fertility Treatments
Infertility treatments can increase the reproductive choices of women and men, but they are often prohibitively expensive, especially when they are not covered by insurance. As of June 2014, the legislatures of 12 states—Arkansas, Connecticut, Hawaii, Illinois, Maryland, Massachusetts, Montana, New Jersey, New York, Ohio, Rhode Island, and West Virginia—had passed measures requiring insurance companies to cover infertility treatments.5 In another two states—California and Texas—insurance companies had to offer infertility coverage to their policy holders (National Conference of State Legislatures 2015).6
Mandatory Sex Education in Schools
Research has shown that sex education is critical to giving young women and men the knowledge they need to make informed decisions about their sexual activity and to avoid unwanted pregnancy and disease (Douglas 2007). In 22 states and the District of Columbia, schools are required to provide sex education.7 One of these states, Tennessee, requires schools to provide sex education if the pregnancy rate among 15- to 17-year-olds is 19.5 per 1,000 or higher. Of the 23 jurisdictions with a statute on the books requiring sex education, all but two—Mississippi and North Dakota— also require HIV education. Eighteen states and the District of Columbia require that information about contraception be included in the curricula, and 37 states require that information regarding abstinence be included (Guttmacher Institute 2015f).
Same-Sex Marriage and Second-Parent Adoption
The laws that shape the ability of individuals in same-sex couples to form the families they want have changed substantially in recent years. Because there is no federal law that guarantees same-sex couples the same parenthood rights afforded to different-sex married couples, state courts have held considerable power to determine what legally constitutes lesbian and gay families. In the past, they have exercised this power in many ways, including by denying lesbian and gay individuals the right to legally adopt their partners’ children or granting them this right through second-parent adoption, which provides legal rights to second parents in same-sex relationships that are automatically available to biological parents. These rights include (but are not limited to) custodial rights in the case of divorce or death and the right to make health care decisions for the child (Movement Advancement Project, Family Equality Council, and Center for American Progress 2011 and 2012).
At the time IWPR’s 2004 Status of Women in the States report was published, second-parent adoption represented the only option for many lesbian and gay individuals seeking to be legal co-parents of their children. Since then, the recognition of marriage for same-sex couples in 37 states and the District of Columbia, whether by legislation or pursuant to a state or federal court ruling (National Center for Lesbian Rights 2015), has opened up new options for same-sex couples. It has given married same-sex couples who have a child together the same parental rights as married different-sex couples.8 In addition, the recognition of same-sex marriage has made stepparent adoption—a legal process available to married couples where the nonbiological parent adopts the child or children of their spouse—a possibility for many individuals in same-sex couples who marry after one or both partners has a child or children.
As of April 2015, same-sex couples had access to marriage statewide in 37 states and the District of Columbia;9 in an additional four states, same-sex couples had access to second-parent or stepparent adoption in certain counties (which had either authorized gay marriage or allowed second-parent adoption, though no statewide legislation or appellate court decision expressly allowing it was in place).10 Nine states do not allow second-parent adoption for same-sex couples or same-sex marriage. Two states that prohibit same-sex marriage have laws that specifically ban second-parent adoption for all couples (Nebraska and Ohio). One state that bans same-sex marriage—Mississippi—specifically prohibits second-parent adoption for same-sex couples but allows it for different-sex couples (National Center for Lesbian Rights 2014).
LGBT Reproductive Rights
The United States has a long and complicated history of debating who deserves to become a parent, and LGBT individuals have often been at the center of this debate. While the traditional conception of the family is shifting, and LGBT reproductive rights are gaining greater recognition, many LGBT individuals still face challenges in their paths to parenthood. These challenges range from finding a culturally competent health care provider to outright discrimination or legal prohibitions in pursuing adoption, foster parenting, surrogacy, or donor insemination (Cooper and Cates 2006; Lambda Legal 2015).
- An estimated 122,000 same-sex couples are raising children under the age of 18 in the United States. Married same-sex couples are considerably more likely to be raising children than unmarried same-sex couples (27 percent compared with 15 percent; Gates 2015).
- While same-sex couples are less likely to be raising children than different-sex couples, same-sex couples are nearly three times as likely to be raising an adopted or foster child (4.0 percent compared with 1.4 percent; Gates 2015). Still, the majority of children of same-sex couples are biologically related to one of their parents (61 percent, compared with 90 percent of children of different-sex couples).
- More than one-third (35 percent) of women of color in same-sex couples are raising a child under the age of 18, compared with 24 percent of white women in same-sex couples (Gates 2015). Seventy-one percent of same-sex married couples and 81 percent of same-sex unmarried couples raising children under the age of 18 are female.
- Six states—California, Massachusetts, New Jersey, Oregon, Rhode Island, and Wisconsin—prohibit discrimination against LGBT parents who want to foster a child. One state, Nebraska, restricts fostering by LGBT parents. Forty-three states and the District of Columbia are silent on the issue (Movement Advancement Project 2015).
- In 35 states and the District of Columbia, LGBT parents can petition for joint adoption statewide. In three states—Louisiana, Michigan, and Mississippi—same-sex couples face legal restrictions when petitioning for joint adoption. In 12 states, the status of joint adoption for same-sex couples is uncertain (Movement Advancement Project 2015)
Fertility, Natality, and Infant Health
Women’s Fertility
The fertility rate for women in the United States has declined in recent years, due in part to women’s tendency to marry and give birth later in life. In 2013, the median age for women at the time of their first marriage was 26.6 years, up from 20.3 years in 1960 (U.S. Census Bureau 2013; Cohn et al. 2011). In 2013, the mean age for women at the time of their first birth was 26.0 years, compared with 21.4 years in 1970 (Martin et al. 2015a; Mathews and Brady 2009).
In 2013, the fertility rate was 62.5 live births per 1,000 women aged 15–44 in the United States. This represents a significant decline since 1960, when the fertility rate was 118.0 births per 1,000 (Martin et al. 2015a). In the ten-year period between 2003 and 2013, the fertility rate among women aged 15–44 declined from 66.1 to 62.5 births per 1,000 women (Martin et al. 2015a).
- New Hampshire has the lowest fertility rate in the nation among women aged 15–44 at 50.8 live births per 1,000, followed by Vermont at 51.4 per 1,000 and Rhode Island at 51.6 per 1,000. In addition to these three states, five other states in the Northeast are among the ten jurisdictions with the lowest fertility rates: Connecticut, Maine, Massachusetts, New York, and Pennsylvania. The District of Columbia and Oregon are also among the ten jurisdictions with the lowest fertility rates (Martin et al. 2015a).
- Utah has the highest fertility rate in the nation at 80.9 live births per 1,000, with South Dakota (78.1 per 1,000) and Alaska (77.8 per 1,000) close behind. Hawaii, Idaho, Kansas, Nebraska, North Dakota, Oklahoma, and Texas are also among the ten states with the highest fertility rates (Martin et al. 2015a).
Prenatal Care
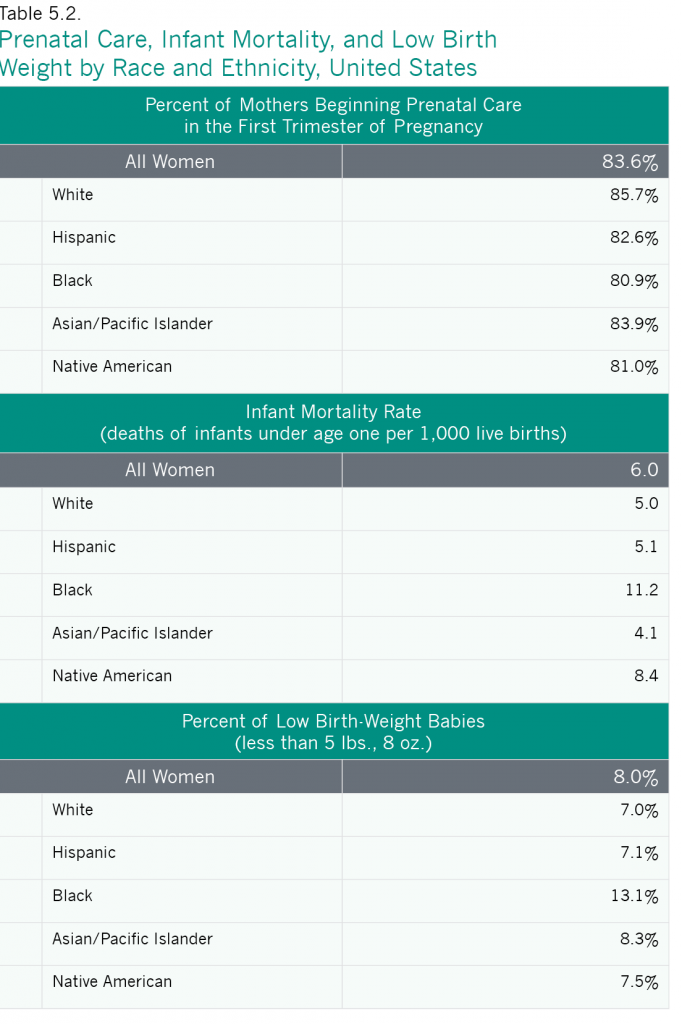
Women who receive prenatal care throughout their pregnancy are, in general, more likely to deliver healthy babies (U.S. Department of Health and Human Services 2009). In the United States in 2011, 84 percent of women began receiving prenatal care in the first trimester of pregnancy, which was a similar proportion to 2001, when 83 percent of all mothers received prenatal care this early in their pregnancy. Between 2001 and 2011, the percentage of women beginning prenatal care in the first trimester of pregnancy has increased among Native American women (a 12 percentage point gain, from 69 to 81 percent). Black and Hispanic women have each experienced a seven percentage point gain (from 74 to 81 percent for black women and from 76 to 83 percent for Hispanic women). The percentage of Asian/Pacific Islander women beginning prenatal care in the first trimester has stayed the same (84 percent), and among white women the percentage of women receiving early prenatal care declined from 89 to 86 percent (IWPR 2004; Table 5.2).
Pregnant women of color are more likely than white women to begin prenatal care toward the end of their pregnancies, or to not receive it at all. One study that analyzed natality data from the Centers for Disease Control and Prevention found that between 2007 and 2013, only 4.4 percent of white women nationwide received late (not beginning until the third trimester) or no prenatal care, compared with 5.4 percent of Asian/Pacific Islander women, 7.6 percent of Hispanic women, 10.0 percent of black women, and 11.3 percent of Native American women (Child Trends 2014).
Low Birth Weight
Low birth weight is a health concern in states across the nation. Nationally, eight percent of babies born in the United States in 2013 had low birth weight (less than five pounds, eight ounces; Martin et al. 2015b). Among the largest racial and ethnic groups, non-Hispanic black women were the most likely to have low-birth weight babies (13.1percent), followed by Asian/Pacific Islander women (8.3 percent), Native American women (7.5 percent), Hispanic women (7.1 percent), and white women (7.0 percent; Martin et al. 2015a).
Nationwide, the percent of babies with low birth weight has increased slightly, from 7.7 percent of babies in 2001 to 8.0 percent in 2013. Among blacks, the percent of babies born with low birth weight stayed the same (13.1 percent in both years), while among whites and Native Americans it increased a bit (from 6.8 to 7.0 percent for whites and 7.3 to 7.5 percent for Native Americans). Among Hispanics and Asian/Pacific Islanders, the percent of babies with low birth weight increased more substantially (from 6.5 to 7.1 percent for Hispanics and from 7.5 to 8.3 percent for Asian/Pacific Islanders; IWPR 2004 and Table 5.2).
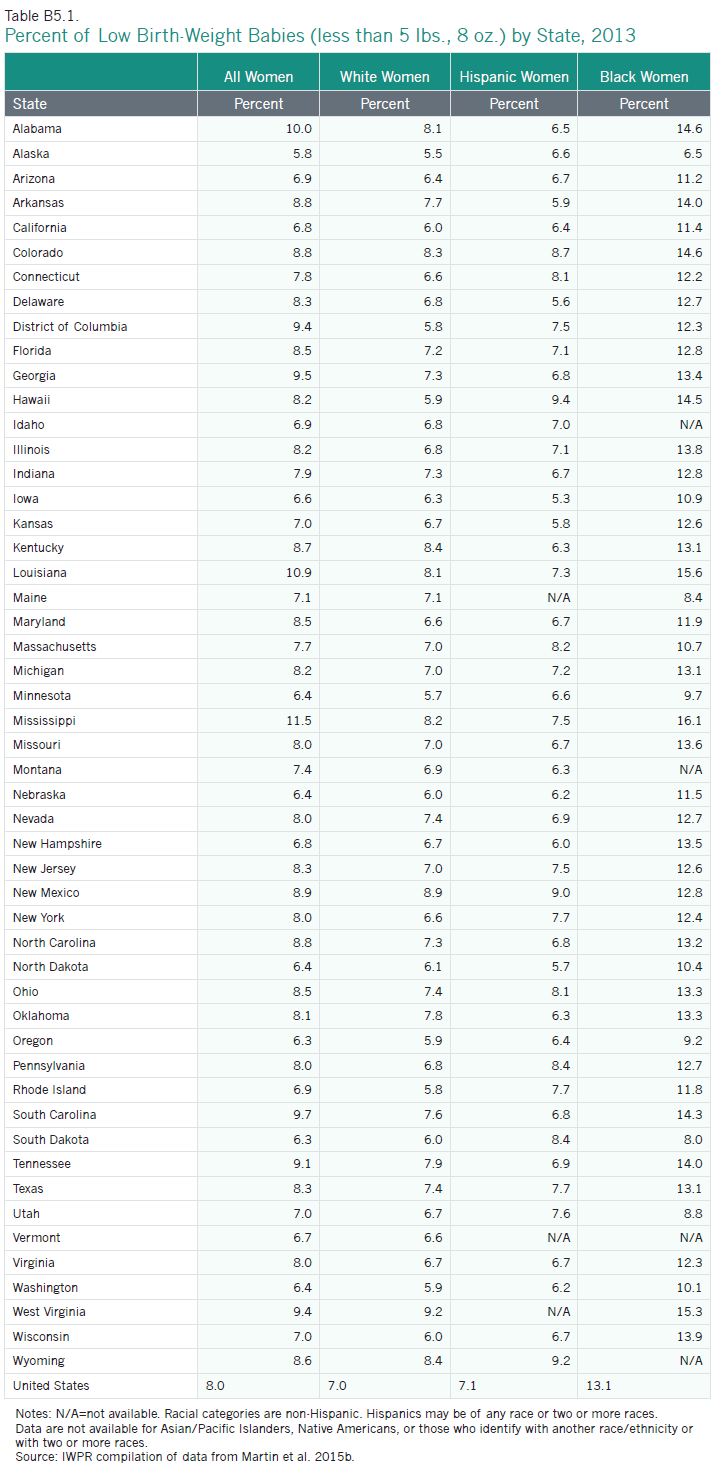
States differ in their proportions of babies born with low birth weight.
- Alaska has the lowest proportion of babies born with low birth weights at 5.8 percent, followed by Oregon and South Dakota (6.3 percent each). California, Iowa, Minnesota, Nebraska, New Hampshire, North Dakota, Vermont, and Washington are also in the best 11 states (with New Hampshire and California tied for 10th place (Appendix Table B5.1).
- Mississippi has the largest proportion of babies born with low birth weight at 11.5 percent, approximately twice the rate of the best-ranking state, Alaska. In general, states in the South have comparatively high proportions of babies born with low birth weight: Alabama, Arkansas, the District of Columbia, Georgia, Louisiana, North Carolina, South Carolina, Tennessee, and West Virginia all rank in the bottom twelve. Colorado (which ties with Arkansas and North Carolina for 40th place) and New Mexico are also a part of this group (Appendix Table B5.1).
Infant Mortality
In the United States overall, infant deaths occur at a rate of 6.0 per 1,000 live births. Among women of the largest racial and ethnic groups, Asian/Pacific Islander women (4.1 per 1,000 live births), white women (5.0 per 1,000 live births), and Hispanic women (5.1 per 1,000 live births) have the lowest rates of infant mortality, while black women and Native American women have the highest rates (11.2 and 8.4 per 1,000 live births, respectively; Centers for Disease Control and Prevention 2013).
Between 2001 and 2012, the infant mortality rate in the United States decreased from 6.8 to 6.0 per 1,000 live births. These gains were experienced across all racial and ethnic groups. Rates of infant mortality among white women decreased from 5.7 to 5.0 per 1,000 births, from 13.5 to 11.2 among black women, from 9.7 to 8.4 among Native American women, from 5.4 to 5.1 among Hispanic women, and from 4.7 to 4.1 per 1,000 births among Asian/Pacific Islander women (IWPR 2004; Table 5.2).
Infant mortality rates vary across states.
- New Hampshire and Massachusetts have the lowest infant mortality rates in the nation, at 4.2 per 1,000, followed by Vermont (4.3 per 1,000). Other states in the top eleven are geographically dispersed: California, Colorado, Hawaii, Nebraska, Nevada, New Jersey, New York, and Utah (the rates in both Hawaii and New York are 5.0 per 1,000; Appendix Table B5.2).
- Alabama has the highest infant mortality rate in the nation, at 9.0 per 1,000 live births, more than double the rate of the best-ranking states. Many states with the lowest rankings are in the South: in addition to Alabama, Louisiana, Mississippi, North Carolina, and South Carolina are in the bottom ten. The District of Columbia, Delaware, Ohio, Oklahoma, and South Dakota are also in this group (Appendix Table B5.2).
Notes: Data for mothers beginning prenatal care in the first trimester of pregnancy are for 2011. Data for infant mortality rate are for 2012. Data for percent of low birth-weight babies are for 2013. For data on prenatal care and low birth-weight, whites and blacks are non-Hispanic; other racial groups include Hispanics. For data on infant mortality, all racial categories are non-Hispanic. Hispanics may be of any race or two or more races.
Source: IWPR compilation of data from the Centers for Disease Control and Prevention 2012a, Centers for Disease Control and Prevention 2013b, and Hamilton et al. 2014c.
Conclusion
Women’s status in the area of reproductive rights has seen minor gains, as well as substantial setbacks, since the publication of IWPR’s 2004 Status of Women in the States report. The rate of infant mortality has declined, states across the nation have recognized same-sex marriage, and many states have expanded their Medicaid programs under the ACA, increasing women’s access to reproductive health services. Yet, the number of states requiring mandatory waiting periods for abortion has increased, and the percentage of low birth weight babies has gone up. While the implementation of the Affordable Care Act has changed the landscape of reproductive health care for women by granting more women access to much needed reproductive and family planning services, some women still face barriers to obtaining the services they need, and women’s reproductive rights continue to be contested in state legislatures across the nation. Increasing access to reproductive rights and resources will help to advance women’s health, economic security, and overall well-being.
Methodology
Appendix Tables

Footnotes
1Two additional indicators examined in this report are: 1) Medicaid expansion and state Medicaid family planning eligibility expansions, which replaces an indicator in IWPR’s previous Status of Women in the States reports on state contraceptive coverage laws; and 2) same-sex marriage or second-parent adoption, which modifies an indicator on second-parent adoption in previous IWPR Status of Women in the States reports. For more on these changes, see Appendix A5 and the sections on Medicaid expansions and on same-sex marriage and second-parent adoption below.
2An additional four states in 2015 had legislation requiring waiting periods for abortions that was part of the statutory code but not enforced.
3Women living in states without a contraceptive equity law must wait until their private health plan loses its grandfathered status to gain full access to no-cost contraceptive coverage (National Women’s Law Center 2012).
4Federal law allows for the expansion of Medicaid to individuals with incomes at or below 133 percent of the federal poverty line. The law also includes a five percent “income disregard,” which effectively makes the limit 138 percent of poverty (Center for Mississippi Health Policy 2012).
5An additional state, Louisiana, prohibits the exclusion of coverage for a medical condition that would otherwise be covered solely because the condition results in infertility.
6A mandate to cover infertility treatments requires health insurance plans sold by licensed insurers to include coverage for these treatments. A mandate to offer coverage means that the plans must provide this coverage, but the person buying the policy does not have to elect coverage for this benefit (Kaiser Family Foundation 2014a).
7This includes states requiring sex education at any grade level (K-12).
8Even in states where same-sex marriage is recognized, in some circumstances there may still be obstacles to consistent legal recognition of nonbiological parents even if they are married to the birth parent (Ming Wong, National Center for Lesbian Rights, personal communication, April 10, 2015).
9In Alabama, a federal district court ruled the state ban on same-sex marriage to be unconstitutional in January 2015. Both the 11th Circuit Court of Appeals and U.S. Supreme Court declined to impose a stay on the court’s order while on appeal. However, the Alabama Supreme Court ordered probate judges in the state to stop issuing marriage licenses to same-sex couples. Couples were seeking a class-action suit in the state’s federal court as of April 2015.
10Of these four states, three (Georgia, Louisiana, and Texas) did not recognize same-sex marriage, but allowed second-parent adoption in certain counties. In one state—Missouri—same-sex couples can marry in certain counties but second-parent adoption is not available to unmarried same-sex couples.