In This Section:
The Health and Well-Being Composite Score
Trends in Women’s Health and Well-Being
Limitations on Women’s Activities
The Health Status of LGBT Women
Preventive Care and Health Behaviors
Introduction
Health is a critical component of women’s economic security and overall well-being. Poor health can pose obstacles to women’s financial stability, educational attainment, and employment, just as good health can enable women to thrive in each of these areas of life. Multiple factors shape women’s health status, including genetics and behaviors. The environments where women live and work also play a role: structural factors such as economic insecurity, access to affordable health care, poor housing quality, lack of safety, inadequate access to healthy food (World Health Organization 2008), and racism (Williams 1999) all influence women’s health and their likelihood of experiencing health problems.
This report provides data on women’s health status in the United States, beginning with a composite index of women’s health that includes nine indicators covering chronic disease, sexual health, mental health, and physical health. It analyzes data on additional aspects of women’s health, including behavioral measures such as smoking, exercise, and diet, and preventive health care measures such as mammograms, pap tests, and screenings for HIV. In addition, the report examines how women’s health status has improved or declined in these areas in recent years. It also notes places where women’s health status varies by race/ethnicity and age and examines the health status of those who identify as a sexual minority.
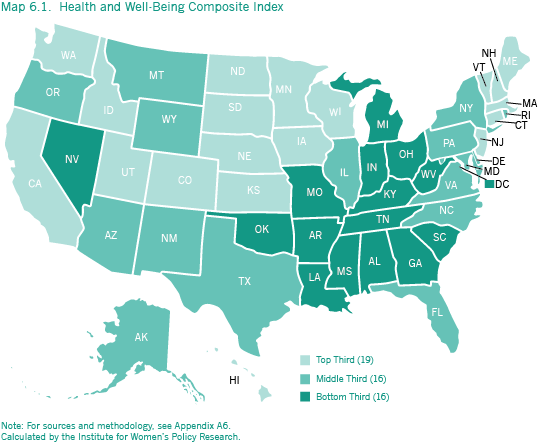
The Health and Well-Being Composite Score
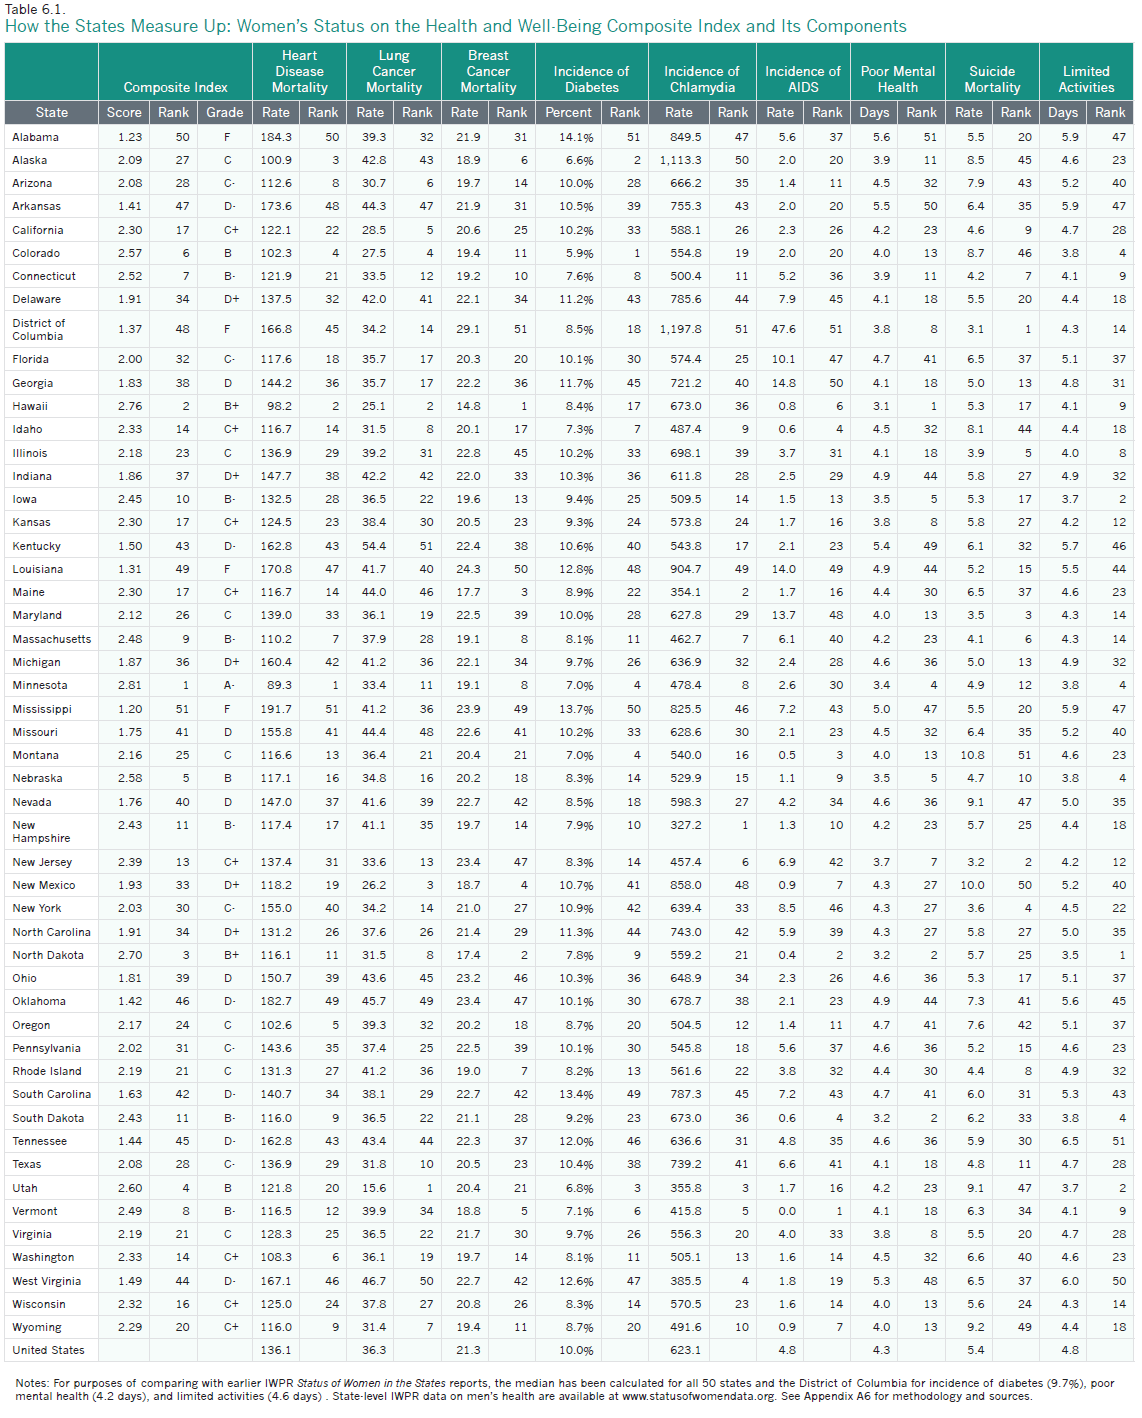
The health and well-being composite index compares the states’ performance on nine component indicators: mortality rates from heart disease, breast cancer, and lung cancer; incidence of diabetes, chlamydia, and AIDS; average number of days per month that mental health is not good; average number of days per month that activities were limited due to health status; and suicide mortality rates. Composite scores ranged from a high of 2.81 to a low of 1.20, with the higher scores reflecting stronger performance in the area of women’s health and corresponding with higher letter grades (Table 6.1). For information on how the composite scores were calculated and grades determined, see Methodology.
| Best and Worst States on Women’s Health and Well-Being | ||||
| State | Rank | Grade | State | Rank |
| Minnesota | 1 | A- | Mississippi | 51 |
| Hawaii | 2 | B+ | Alabama | 50 |
| North Dakota | 3 | B+ | Louisiana | 49 |
| Utah | 4 | B | District of Columbia | 48 |
| Nebraska | 5 | B | Arkansas | 47 |
- Minnesota ranks first in the nation on the composite index of women’s health and well-being. The state has the lowest female mortality rate from heart disease and ranks in the top ten on all other component indicators except for lung cancer and suicide mortality rates and incidence of AIDS, for which the state ranks 11th, 12th, and 30th, respectively. In the 2004 Status of Women in the States report, Minnesota ranked second in the nation, behind Utah.
- Mississippi ranks last among all states and the District of Columbia for women’s health. It has the worst ranking on mortality from heart disease, and the second to worst ranking on the percentage of women with diabetes. The state also ranks in the bottom ten for mortality from breast cancer, the average number of days per month on which health status limited women’s activities, incidence of AIDS and chlamydia, and poor mental health.
- The best ten states for women’s health are all in the Western, Northeastern, or Midwestern parts of the country. In addition to Minnesota, the best-ranking states include Colorado, Connecticut, Hawaii, Iowa, Massachusetts, Nebraska, North Dakota, Utah, and Vermont.
- States in the South have the lowest composite scores on women’s health status. Alabama, Arkansas, Kentucky, Louisiana, Mississippi, South Carolina, Tennessee, and West Virginia rank among the bottom ten states. The District of Columbia and Oklahoma are also in the bottom ten.
- One state—Minnesota—received an A- on the composite index of health and well-being. Hawaii and North Dakota received a B+. Four jurisdictions—Alabama, the District of Columbia, Louisiana, and Mississippi—received grades of F. For information on how grades were determined, see Methodology.
Trends in Health and Well-Being
In the United States overall, women’s health status has improved in some areas and declined in others. Women’s mortality rates from heart disease, lung cancer, and breast cancer have decreased since the publication of IWPR’s 2004 Status of Women in the States report, as has the incidence of AIDS among female adolescents and adults. Women’s incidence of chlamydia and diabetes, however, have increased (IWPR 2004; Table 6.1). In addition, the average number of poor mental health days per month, suicide mortality rate, and average number of days per month of limited activities have also gone up for women.
- On the composite score for women’s health, only the District of Columbia and 10 states—California, Colorado, Connecticut, Delaware, Florida, Kentucky, Maine, Nebraska, New Jersey, and Texas—have improved in their scores. Delaware and California experienced the largest gains, with scores that increased by 8.5 and 7.0 percent, respectively. Both states moved up in the rankings on the composite index since the 2004 data release; Delaware moved up from 45th place to 34th, and California from 29th place to 17th.
- Among states whose composite scores have declined, Alabama and Tennessee experienced the biggest losses, with scores that decreased by 27.6 and 25.4 percent. Both states slid down in the rankings since the 2004 data release; Alabama fell from 46th to 50th place, and Tennessee moved down from 38th to 45th
What Has Improved
- Nationally, the rate of heart disease among women of all ages declined 36 percent between 2001 and 2013, from 211.5 to 136.1 per 100,000.1 All states in the nation have experienced a decrease, with the biggest declines in Florida and California (40 percent each), New Hampshire (39 percent), and Maine, Alaska, New York, and Massachusetts (38 percent each; IWPR 2004 and Table 6.1).
- The lung cancer mortality rate among women of all ages in the United States declined between 2001 and 2013 from 41.0 per 100,000 to 36.3 per 100,000, or about 11 percent. The states experiencing the greatest declines are in the West: California (26 percent), Nevada (24 percent), Washington (23 percent), Wyoming (21 percent), and Arizona (20 percent). Eight states had a higher female lung cancer mortality rate in 2013 than in 2001, including South Dakota (their rate increased by 15 percent), Vermont and Wisconsin (their rates increased by four percent), and Kentucky, Iowa, Arkansas, Alabama, and Oklahoma, which experienced smaller increases (IWPR 2004; Table 6.1).
- The female breast cancer mortality rate in the United States overall decreased 20 percent between 2001 and 2013, from 26.5 per 100,000 to 21.3 per 100,000. Every state in the nation experienced a decline, with the largest improvements in Vermont (which had a 32 percent drop in its mortality rate), North Dakota (a 31 percent decline), Massachusetts (a 29 percent decrease), and Maine and Rhode Island (which had 28 and 27 percent declines, respectively; IWPR 2004 and Table 6.1).
- Between 2001 and 2012, the incidence of AIDS among adolescent and adult women aged 13 years and older decreased 47 percent nationally, from 9.1 per 100,000 to 4.8 per 100,000. Nine states—Arizona, Connecticut, Delaware, Florida, Hawaii, New Jersey, New York, South Dakota, and Vermont—experienced a decline of 50 percent or more in their female AIDS incidence rate. All but nine states—Alaska, Georgia, Iowa, Kansas, Louisiana, Minnesota, North Dakota, Utah, and Wyoming—experienced a decrease in their AIDS incidence rate among women during this time (IWPR 2004 and Table 6.1).
What Has Worsened
- Across the 50 states and the District of Columbia, the median percentage of women aged 18 and older who have ever been told they have diabetes increased between 2001 and 2013 from 6.5 percent to 9.7 percent, an increase of about 49 percent during this time period (IWPR 2004; Table 6.1). 2 Arizona experienced the greatest rise in its diabetes incidence rate among women, from 4.9 percent of women with diabetes in 2001 to 10.0 percent in 2013, a 104 percent increase. Montana had the smallest increase, from 6.2 percent to 7.0 percent, about a 13 percent increase.3
- The incidence of chlamydia among women of all ages in the United States increased 37 percent between 2002 and 2013, from 455.4 to 623.1 per 100,000. The rate of increase varies widely among states. North Dakota had the largest increase at 118 percent (from 256.8 per 100,000 to 559.2 per 100,000), followed by Massachusetts (an 86 percent increase, from 248.5 per 100,000 to 462.7 per 100,000) and Arkansas (a 78 percent increase, from 425.0 per 100,000 to 755.3 per 100,000). Georgia, Connecticut, Colorado, Hawaii, and Mississippi had the smallest increases.
- The median number of days per month on which women aged 18 and older in the United States overall report experiencing poor mental health increased from 3.8 to 4.2 between 2000 and 2013, or about 11 percent. Only four jurisdictions—the District of Columbia, New Mexico, Virginia, and Wisconsin—improved on this indicator during this time period. Oklahoma and Alabama experienced the largest increase in the average number of poor mental health days, followed by Arizona, Arkansas, and Louisiana.
- The suicide mortality rate among all women increased 35 percent between 2001 and 2013, from 4.0 per 100,000 to 5.4 per 100,000. Every state in the nation experienced an increase during this time period. The suicide mortality rate of the District of Columbia, which had the lowest rate in 2001, more than doubled between 2001 and 2013, from 1.3 per 100,000 to 3.1 per 100,000, but the District still retained its best ranking. Montana (which ranked 42nd in 2001) also saw an especially large increase, from 5.7 to 10.8 per 100,000, which is double the national average. Other states with the biggest increases include South Dakota (their rate grew from 3.6 to 6.2 per 100,000), Iowa (their rate grew from 3.1 to 5.3 per 100,000), and Vermont (their rate grew from 3.7 to 6.3 per 100,000). States with the smallest increases include Alaska, New Jersey, Hawaii, Georgia, and Maryland (IWPR 2004; Table 6.1).
- Nationwide, the median number of days per month on which women aged 18 and older reported that their activities were limited by their mental or physical health status increased between 2000 and 2013 from 3.5 to 4.6, or about 31 percent. Nebraska and Kentucky experienced small improvements on this indicator; all other states and the District of Columbia experienced a decline. Women in Tennessee, Missouri, Mississippi, and Virginia had the largest increases in their self-reported number of days with activity limitations per month (IWPR 2004; Table 6.1).
Women’s Access to Health Care Services and Resources
Health insurance gives women access to critical health services. In the United States in 2013, 81.5 percent of nonelderly women (aged 18–64) had health insurance coverage, a higher proportion than men of the same age range (77.1 percent; IWPR 2015a). These data do not reflect the full implementation of the Patient Protection and Affordable Care Act (ACA) of 2010, which enacted measures to expand access to affordable health insurance coverage for those who lack coverage, including creating state-based exchanges through which individuals can purchase coverage (with premium and cost-sharing benefits available to those with low incomes); establishing separate exchanges through which small businesses can purchase health insurance coverage for their employees; and seeking to expand Medicaid eligibility to all individuals under age 65 who are not eligible for Medicare and have incomes up to 138 percent of the federal poverty line (Kaiser Family Foundation 2013a).4,5 Recent data show that women’s health insurance coverage has increased substantially since the implementation of the ACA. Between 2008 and 2014, uninsurance rates for women of all ages dropped by almost one-fifth, from 13.0 percent of women lacking coverage in 2008 to 10.6 percent in the first nine months of 2014 (Martinez and Cohen 2009 and 2015).
The ACA has also changed the landscape of health care coverage for women in the United States by requiring health plans to cover annual well-woman visits and preventive services such as mammograms and pap tests with no cost sharing. Yet, state policies continue to contribute to women’s health status in important ways. For example, states can choose to opt out of the Medicaid expansion; as of April 2015, 29 states and the District of Columbia had adopted the expansion, and five were deciding whether to do so (Kaiser Family Foundation 2015a). Research indicates that women in the states that had not chosen to expand Medicaid coverage may especially struggle to access needed services. One report found that in these 22 states that had not expanded Medicaid coverage as of October 2014, more than three million women with low incomes fall into a “coverage gap” and have no affordable coverage options (National Women’s Law Center 2014).
Other factors also limit many women’s access to health care resources, such as a lack of transportation, substantial travel time needed to get to the doctor, and limited availability of health care services in one’s community (Kullgren et al. 2012). In addition, immigrant women and men face multiple barriers in accessing basic health coverage, including a federal law that bans many immigrants from means-tested benefit programs such as Medicaid in their first five years of legal status (Broder and Blazer 2011; National Immigration Law Center 2014).6
Chronic Disease
Heart Disease
One in four women in the United States dies from heart disease (U.S. Department of Health and Human Services 2014). Coronary heart disease—which is the most common form—is the leading cause of death among both women and men. In addition, women are at higher risk than men for other forms of heart disease, such as coronary microvascular disease (in which the walls of the heart’s tiny arteries are damaged or diseased) and stress-induced cardiomyopathy (in which emotional stress leads to severe—but often temporary—heart muscle failure; U.S. Department of Health and Human Services 2014).
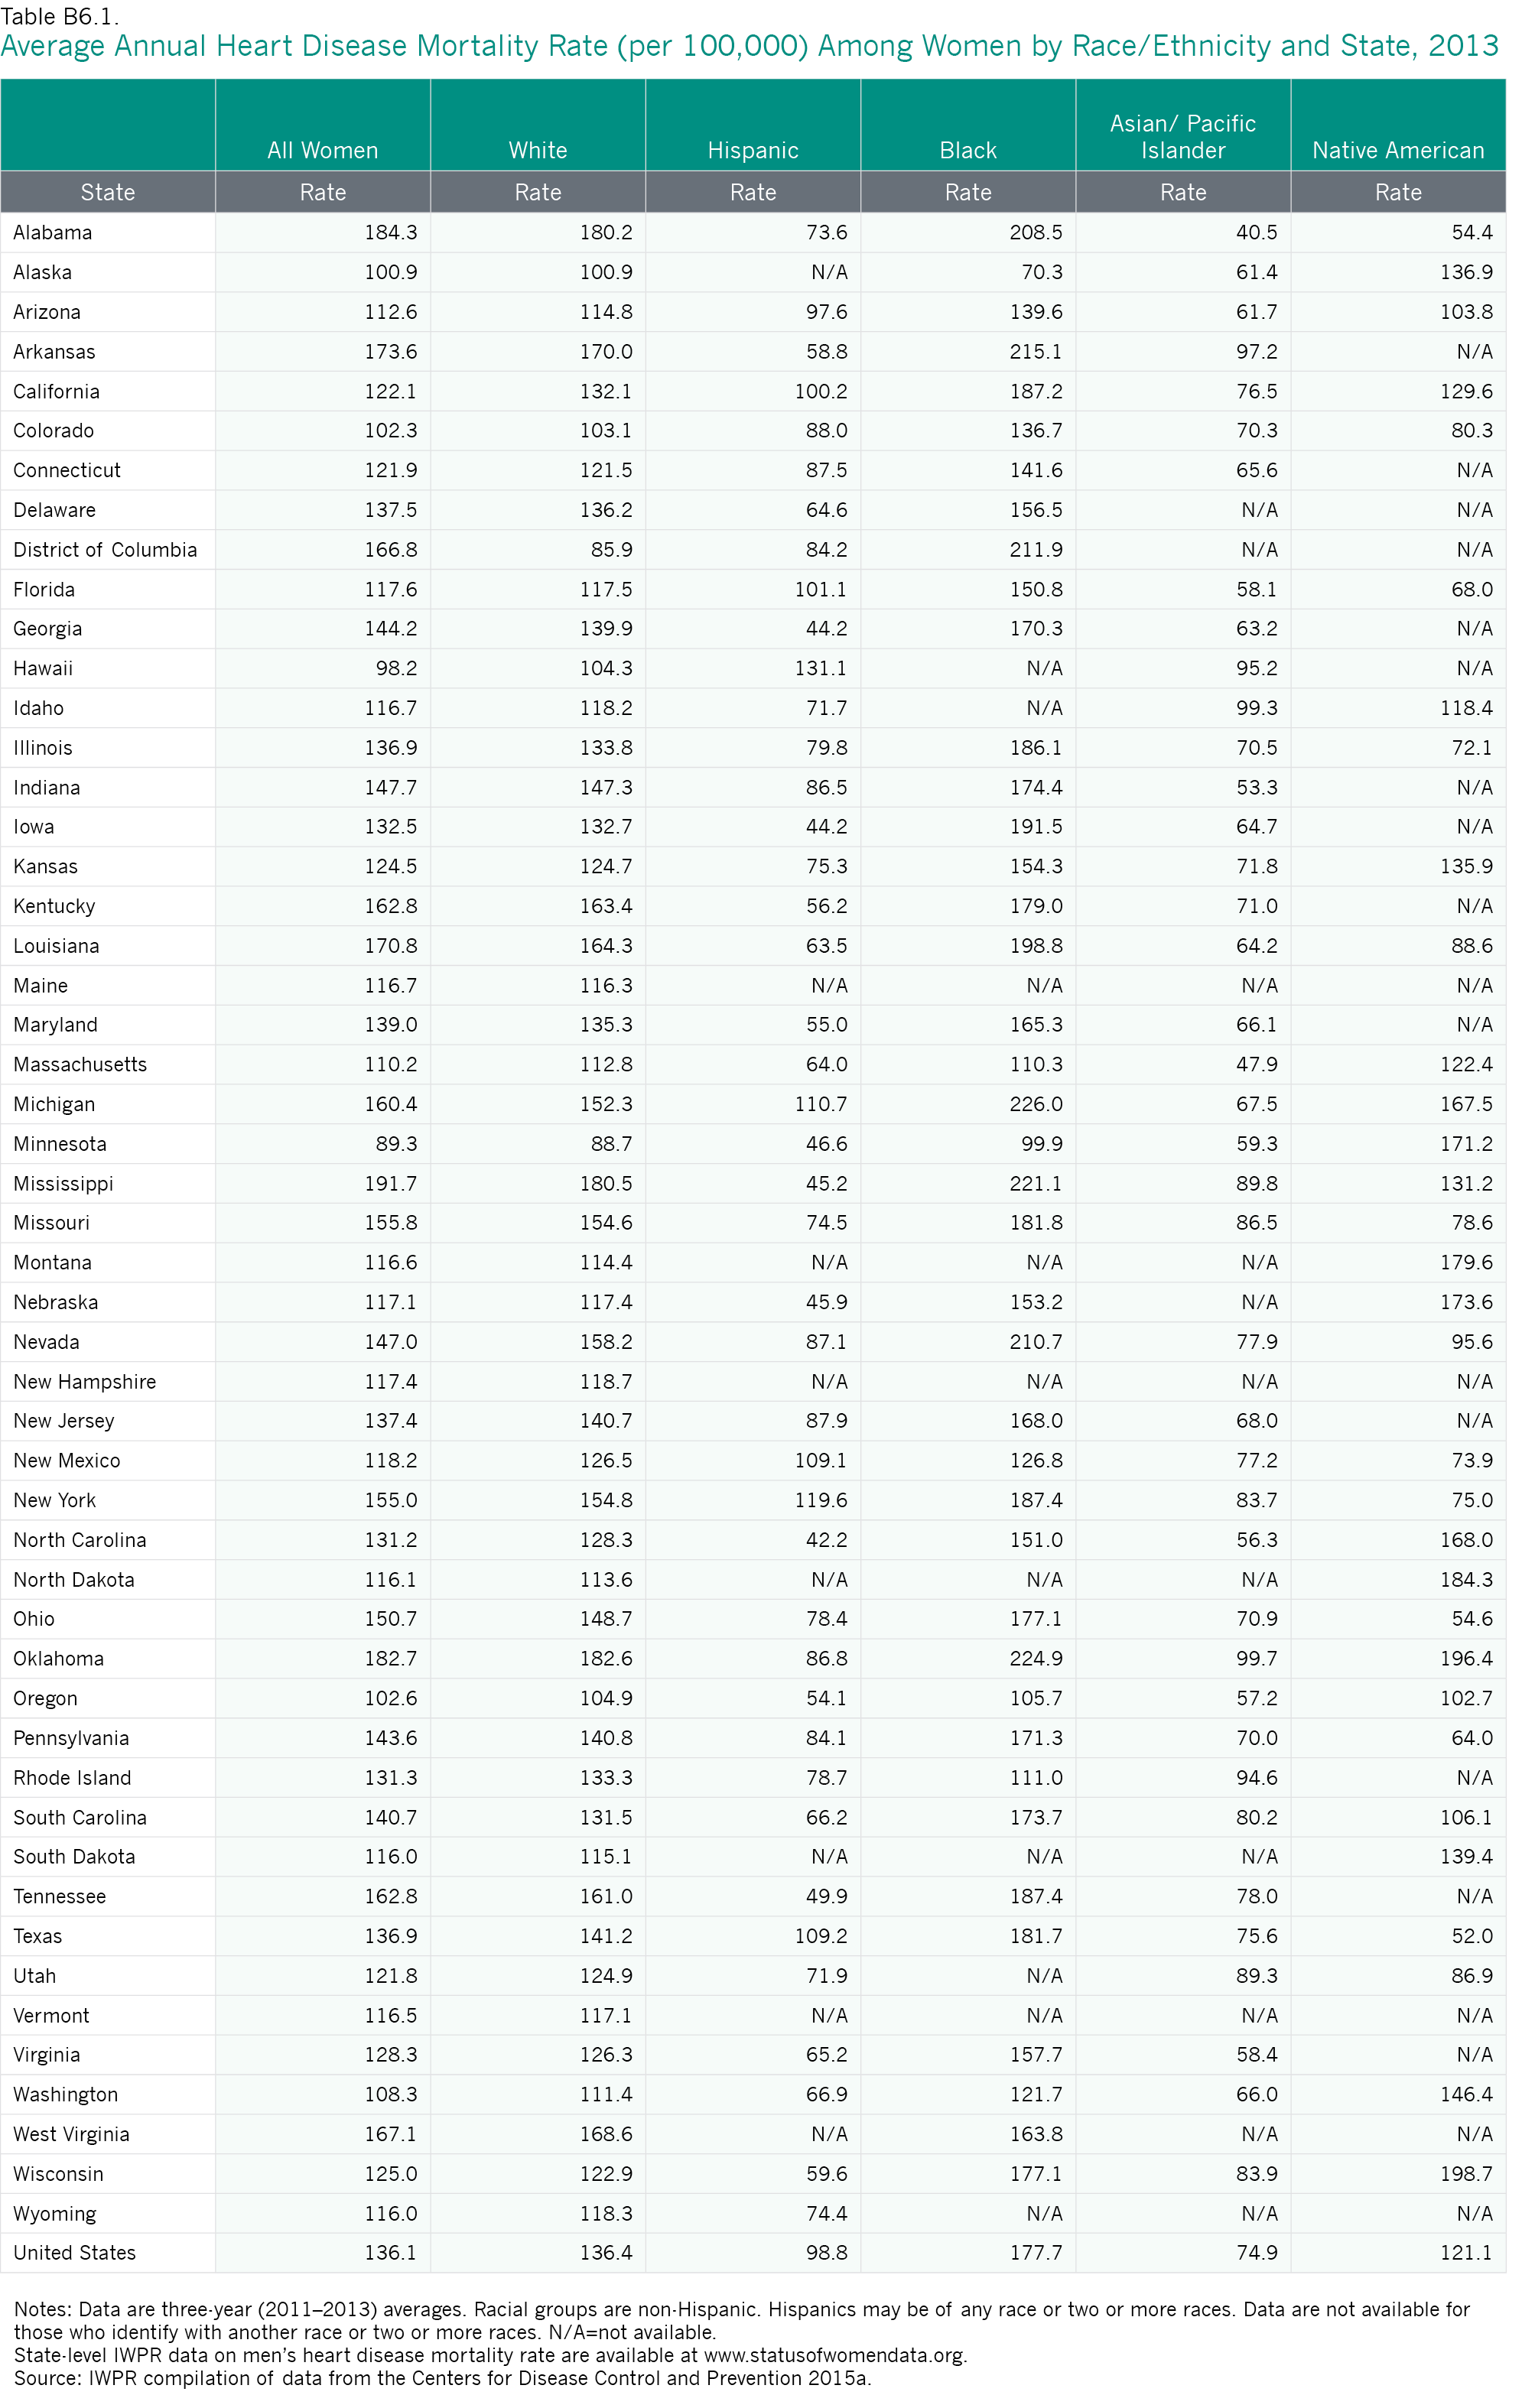
Nationwide, the mortality rate from heart disease among women of all ages is 136.1 per 100,000 (Table 6.1), meaning that more than 136 in 100,000 women die of heart disease each year. Heart disease mortality rates, however, vary considerably across states.
| Best and Worst States on Women’s Heart Disease Mortality | ||||
| Mortality Rate per 100,000 | Rank | State | Mortality Rate per 100,000 | Rank |
| 89.3 | 1 | Mississippi | 191.7 | 51 |
| 98.2 | 2 | Alabama | 184.3 | 50 |
| 100.9 | 3 | Oklahoma | 182.7 | 49 |
| 102.3 | 4 | Arkansas | 173.6 | 48 |
| 102.6 | 5 | Louisiana | 170.8 | 47 |
- Among the 50 states and the District of Columbia, Minnesota has the lowest heart disease mortality rate for women (89.3 per 100,000), followed by Hawaii (98.2 per 100,000) and Alaska (100.9 per 100,000). Minnesota and Hawaii also ranked first and second on this indicator when the 2004 Status of Women in the States report was published, while Alaska moved up from seventh place to third.
- The rate of heart disease mortality in the worst state, Mississippi (191.7 per 100,000), is more than twice the rate of Minnesota, the best state. Alabama (184.3 per 1,000) and Oklahoma (182.7 per 1,000) are the second- and third-worst ranking states on this indicator.
- The best ten states for women’s mortality from heart disease are primarily in the western United States. In addition to Hawaii and Alaska, five states in the West—Arizona, Colorado, Oregon, Washington, and Wyoming—are among the best ten states. Massachusetts and South Dakota are also in the group of best-ranking states, along with Minnesota.
- Mortality rates from heart disease are the highest in the South. In addition to Alabama and Mississippi, five other states in the South—Arkansas, Kentucky, Louisiana, Tennessee, and West Virginia—are among the ten worst-ranking states. The District of Columbia, Michigan, and Oklahoma are also in the bottom ten.
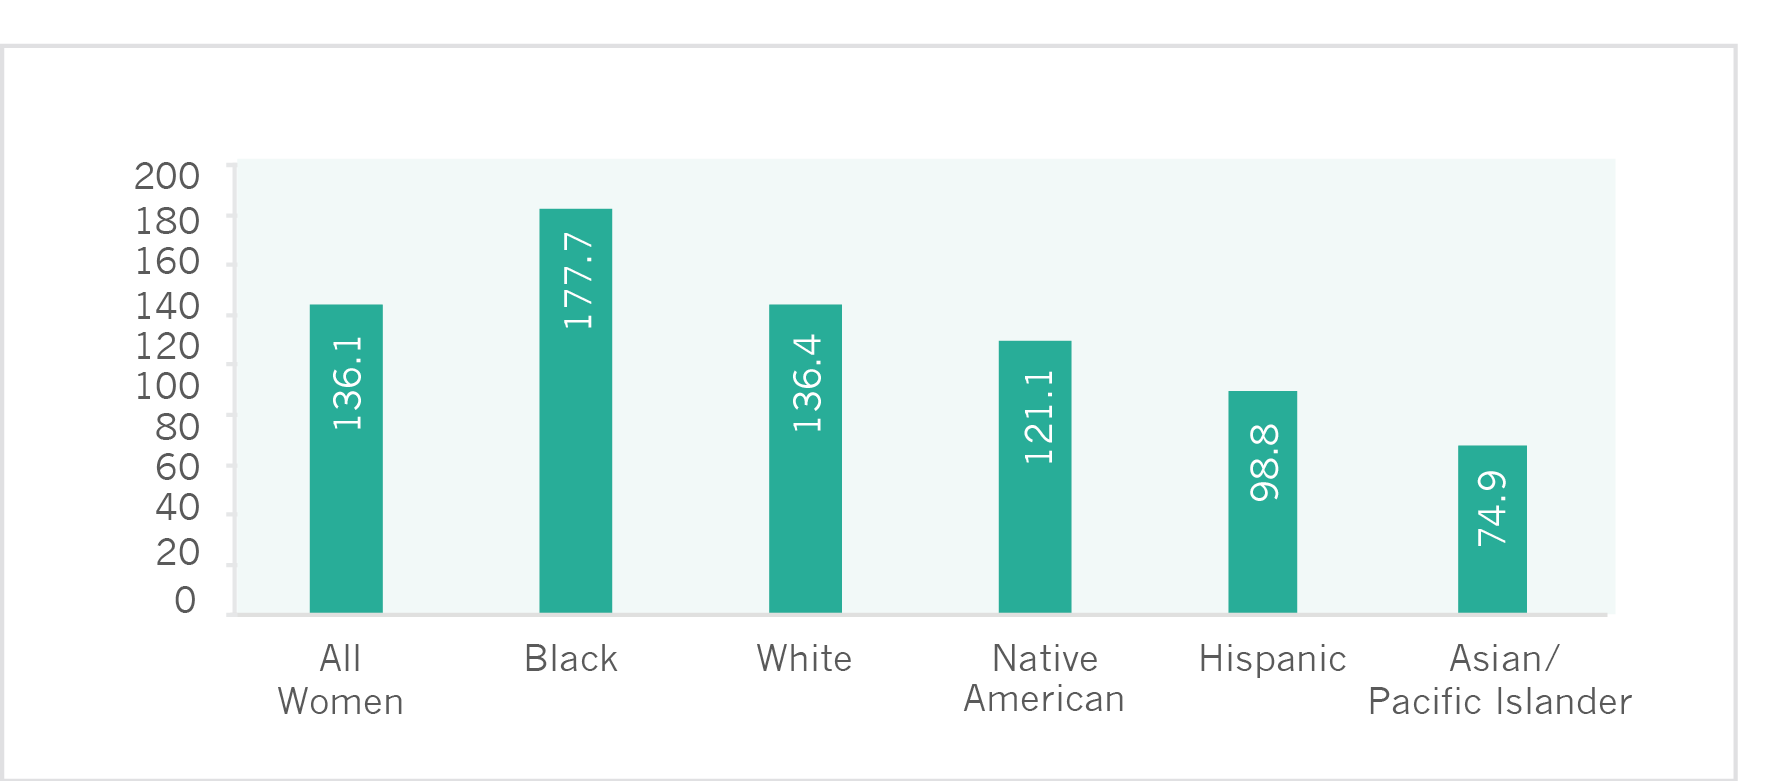
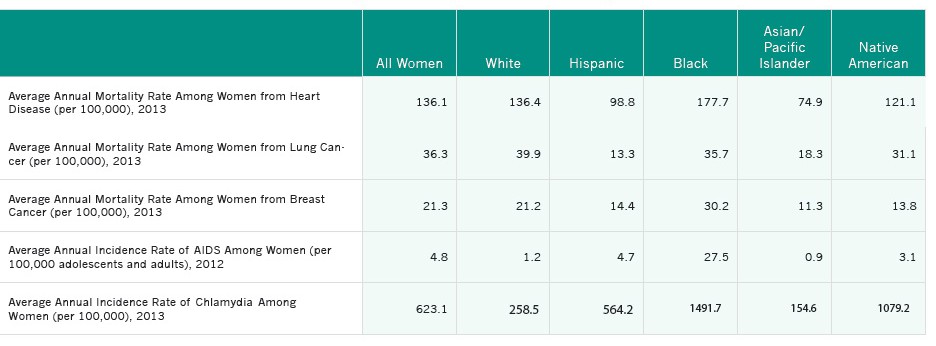
As Figure 6.1 shows, mortality rates from heart disease vary substantially by race and ethnicity. Black women have the highest rate at 177.7 per 100,000, followed by white women (136.4 per 100,000) and Native American women (121.1 per 100,000). Asian/Pacific Islander and Hispanic women have the lowest rates of heart disease mortality at 74.9 and 98.8 per 100,000, respectively (Figure 6.1; Appendix Table B6.1). Although Asian/Pacific Islander women have the lowest rate, heart disease remains the second biggest killer for this group (Centers for Disease Control and Prevention 2014a), and rates of heart disease mortality differ across Asian/Pacific Islander populations. One study that examined heart disease mortality rates among Asian Indian, Chinese, Filipino, Japanese, Korean, and Vietnamese women and men found that Asian Indian women and men had the highest rates of mortality among these groups and were more likely to die from heart disease than non-Hispanic white women and men (Jose et al. 2014).
Figure 6.1. Heart Disease Mortality Rates (per 100,000) Among Women by Race/Ethnicity, United States, 2013
Note: Data include women of all ages and are age-adjusted to the 2000 U.S. standard population.
Source: IWPR compilation of data from the Centers for Disease Control and Prevention 2015a.
Cancer
The nation has made considerable progress in the prevention, detection, and treatment of certain forms of cancer in recent decades. Nevertheless, cancer is the second leading cause of death for all women in the United States (Centers for Disease Control and Prevention 2013a). Lung and breast cancer are the forms of cancer from which women are most likely to die (Centers for Disease Control and Prevention 2013b).
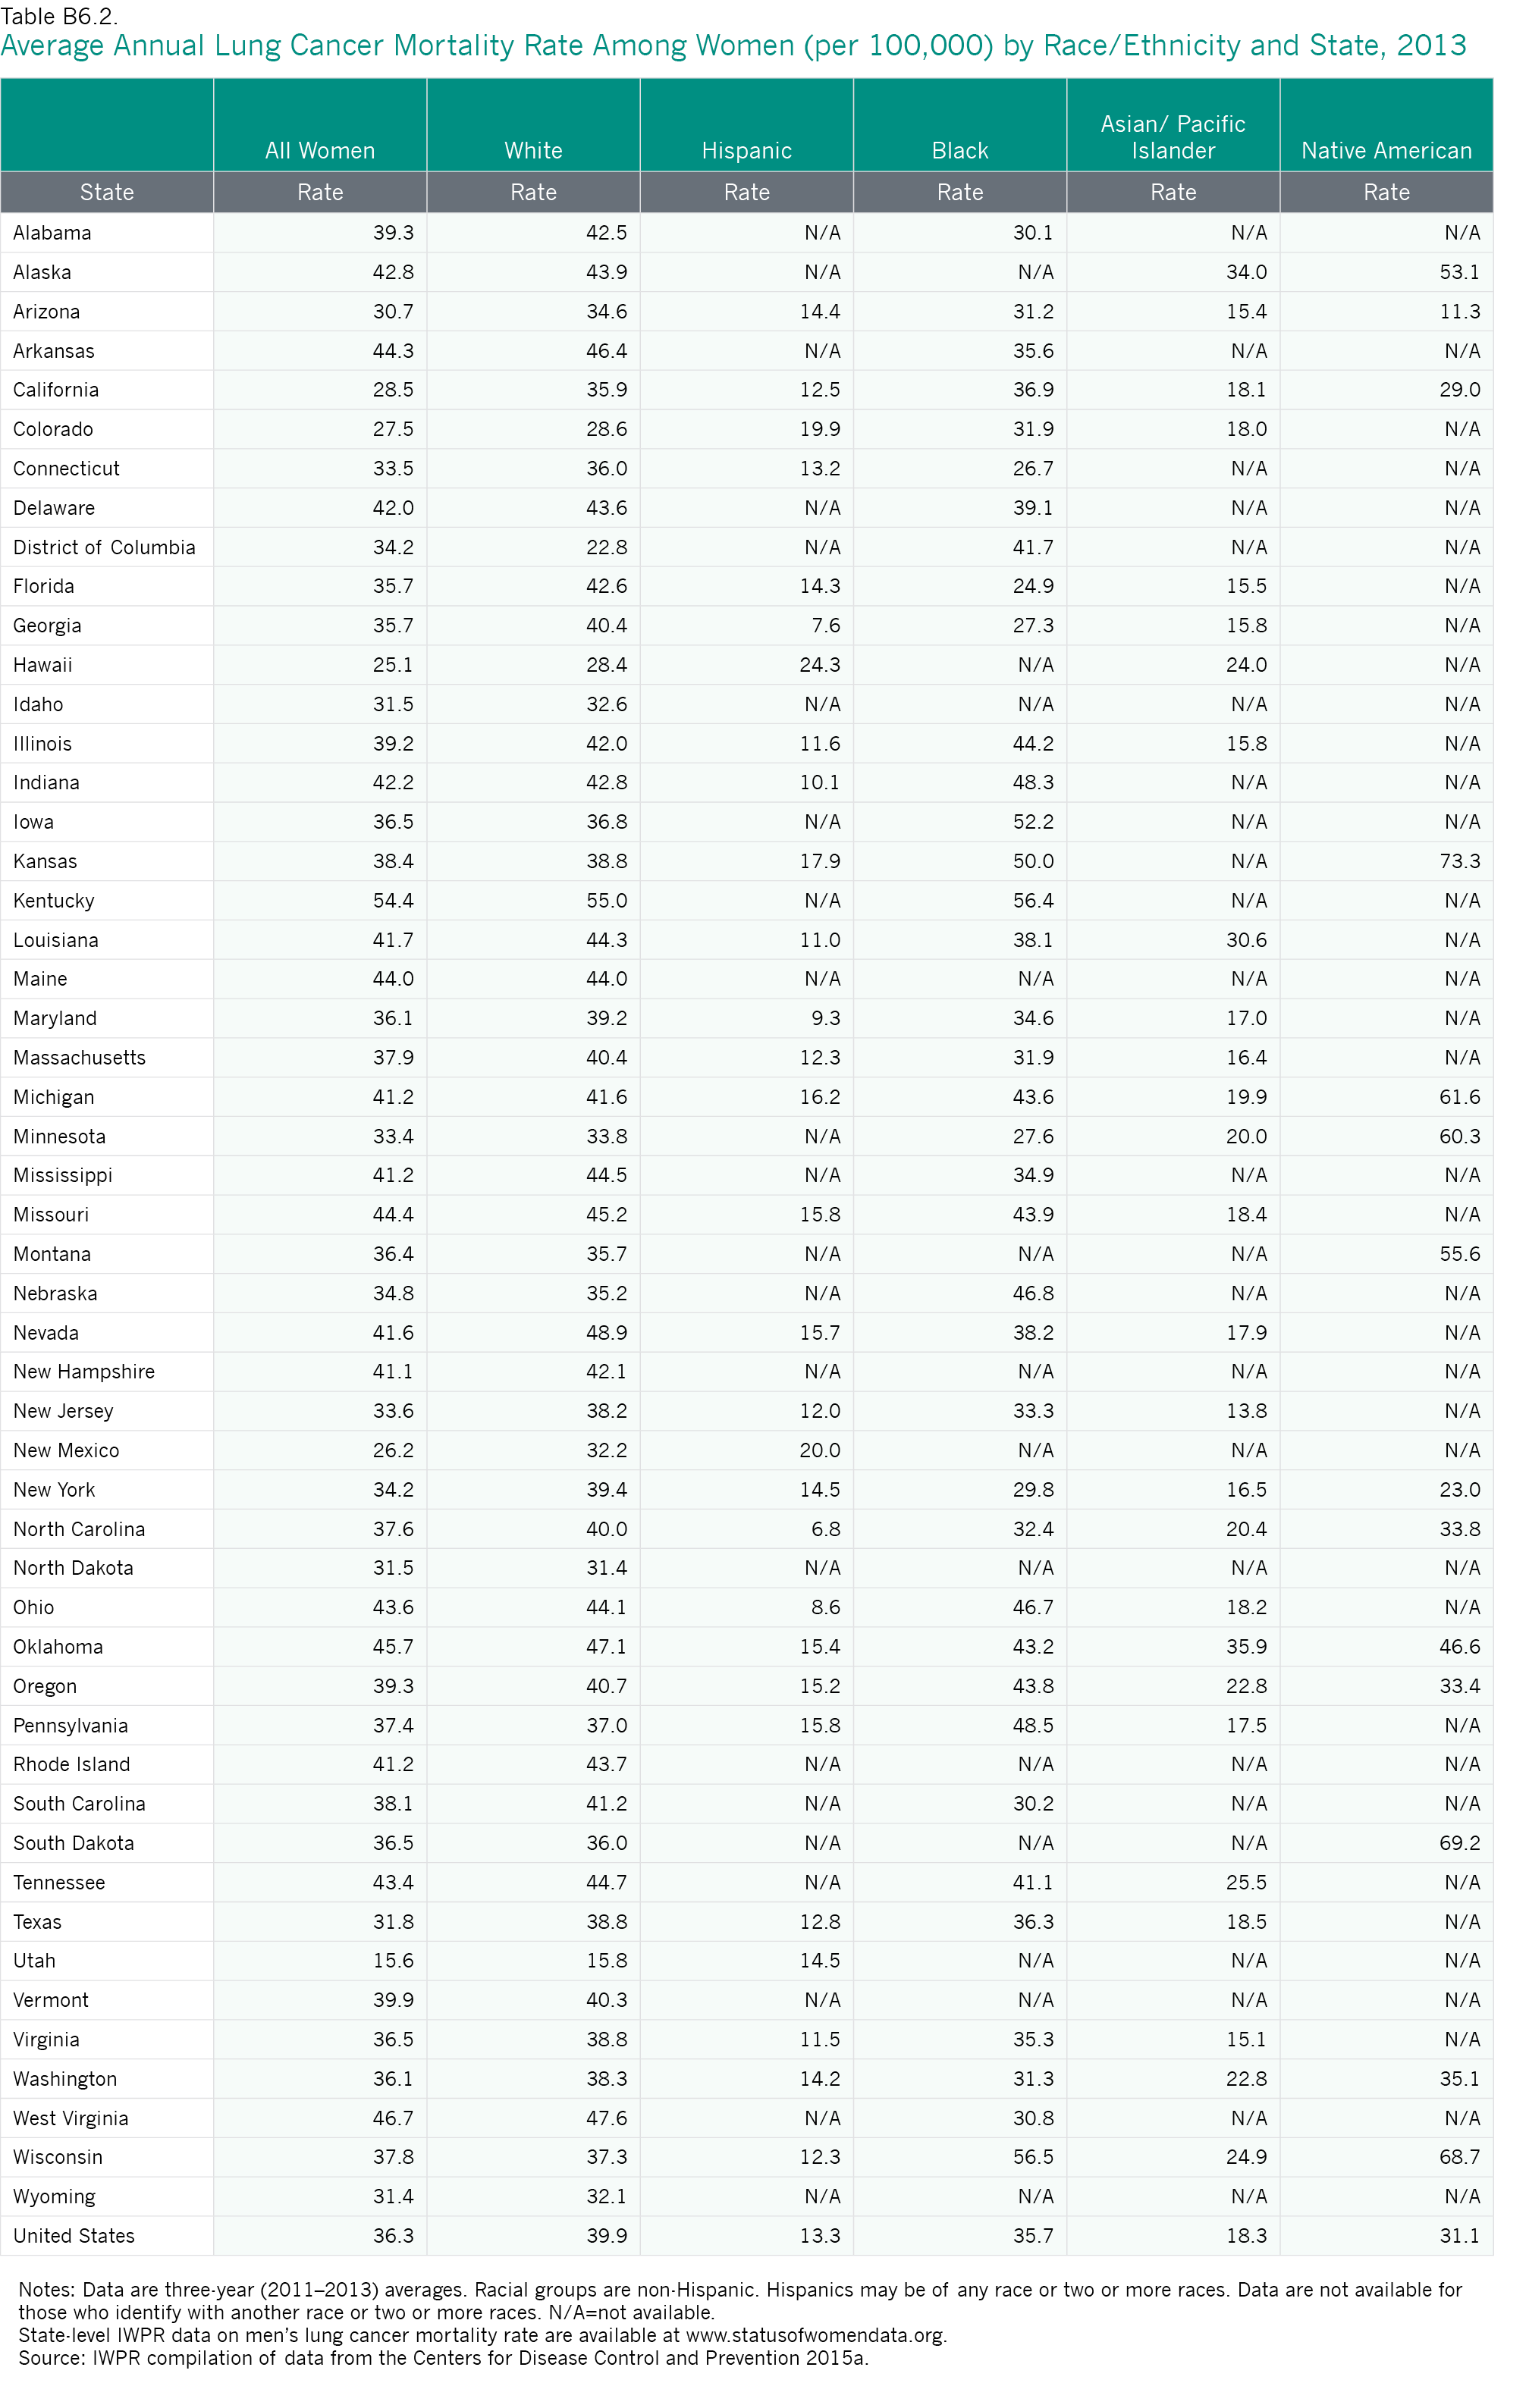
Nationally, the mortality rate from lung cancer among women of all ages is 36.3 per 100,000 (Table 6.1). Since lung cancer, like heart disease, is often linked to cigarette smoking, efforts to raise public awareness about the health risks of smoking are essential to reducing lung cancer incidence and mortality. The female mortality rate from lung cancer of 36.3 per 100,000 represents a decline in the mortality rate among women from this disease since 1999–2001, when the rate was 41.0 per 100,000 (IWPR 2004; Table 6.1). This decline is due, in part, to tobacco prevention and control efforts (Henley et al. 2014).
- Utah has the lowest lung cancer mortality rate for women at 15.6 per 100,000. The second-ranking state, Hawaii, has a much higher female mortality rate from lung cancer (25.1 per 100,000).
- Kentucky has the highest lung cancer mortality rate for women with a rate of 54.4 per 100,000, followed by West Virginia at 46.7 per 100,000.
- In general, states in the West and Southwest have low mortality rates from lung cancer for women. In addition to Utah and Hawaii, seven states from these regions—Arizona, California, Colorado, Idaho, New Mexico, Texas, and Wyoming—are among the ten best ranking states. North Dakota is also in the top ten.
- Most of the states with the highest lung cancer mortality rates for women are in the South and the Midwest. In addition to Kentucky and West Virginia, Arkansas, Indiana, Missouri, Ohio, Oklahoma, and Tennessee are in the bottom ten. Alaska and Maine are also a part of this group.
Lung cancer mortality rates vary sharply among the largest racial and ethnic groups. In the United States overall, white women have the highest rate (39.9 per 100,000), followed by black women (35.7 per 100,000). Hispanic women have the lowest rates of lung cancer mortality (13.3 per 100,000), followed by Asian/Pacific Islander women (18.3 per 100,000 women; Table 6.2).
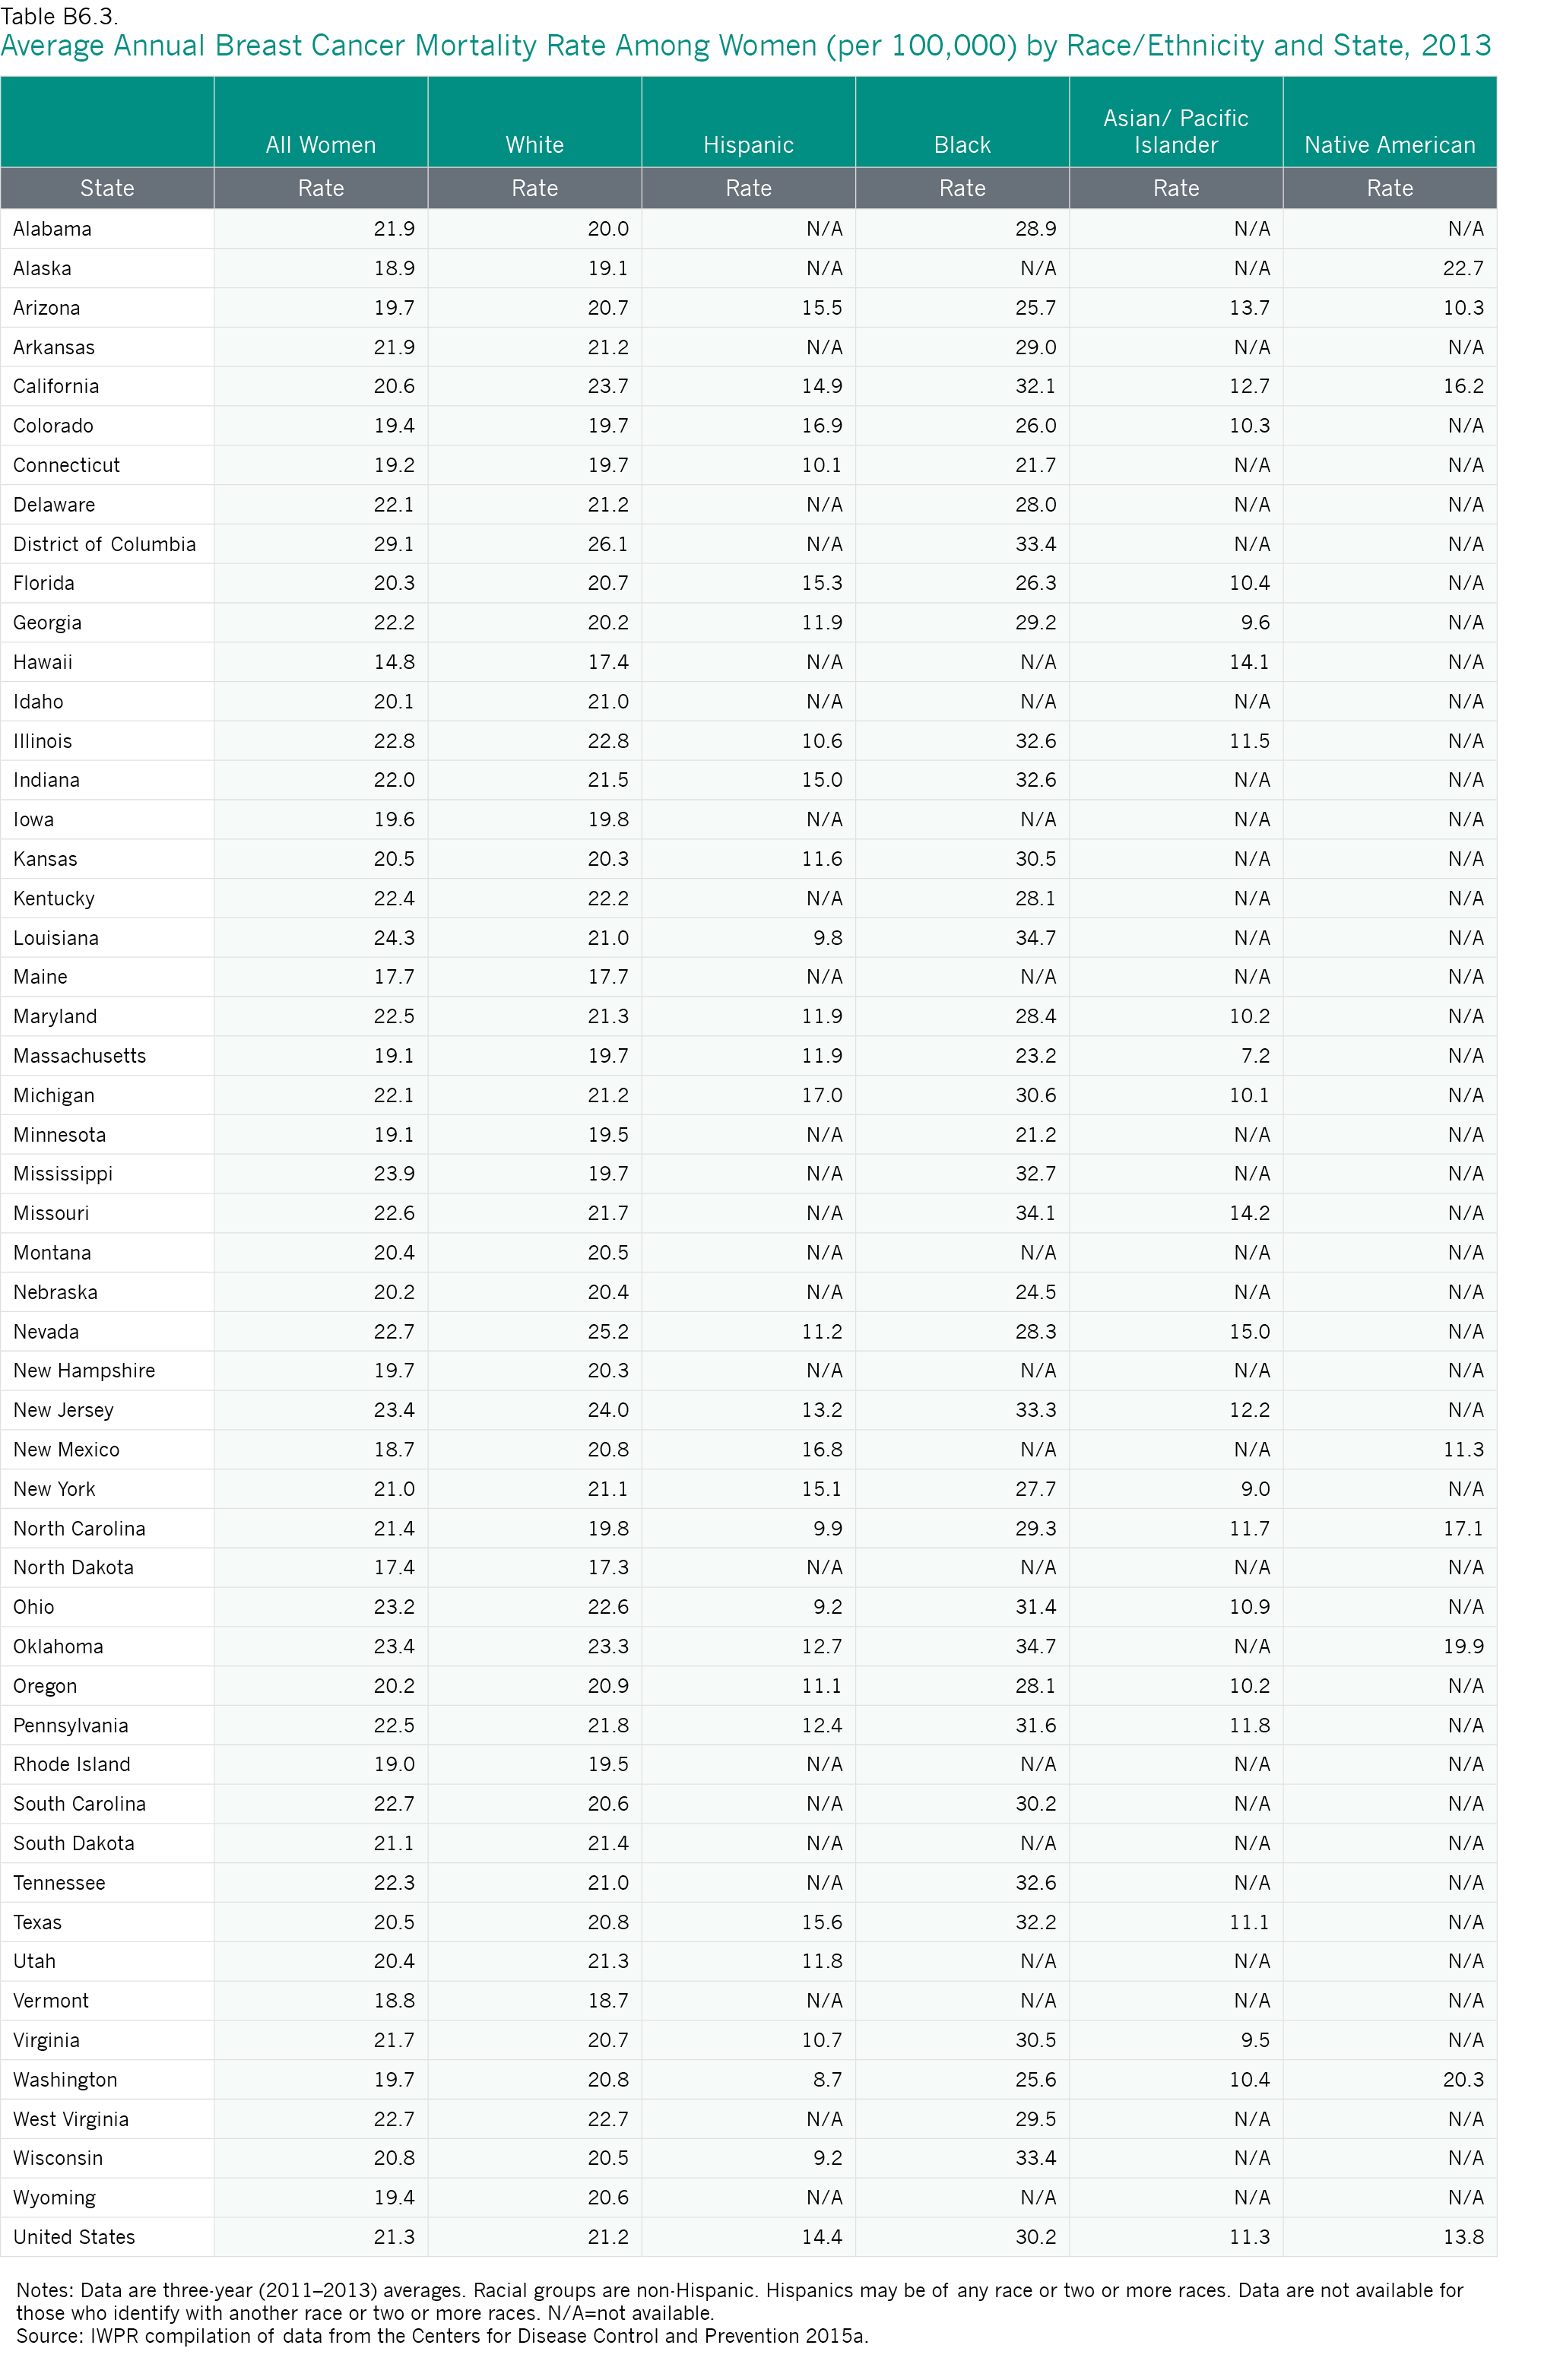
While lung cancer is the deadliest cancer for women in the United States, breast cancer is the most common form of the disease. Approximately 231,840 new cases of breast cancer and 40,290 deaths are expected among the nation’s women in 2015 (American Cancer Society 2015). Nationally, the mortality rate for women of all ages from breast cancer is 21.3 per 100,000 (Table 6.1).
- Hawaii is the best state in the nation for mortality from breast cancer with a rate of 14.8 per 100,000, followed by North Dakota, which has a rate of 17.4 per 100,000. While Hawaii was also ranked first in the 2004 report, North Dakota rose from 19th in the 2004 rankings to second place.
- The District of Columbia, which ranks last on women’s breast cancer mortality rate, has a rate that is almost twice as high (29.1 per 100,000) as the rate for Hawaii, the best ranking state. The District of Columbia was also last in the 2004 Status of Women in the States
- Half of the states in the top ten are from the Northeast, including Connecticut, Maine, Massachusetts, Rhode Island, and Vermont. Other states in the top ten are Alaska, Minnesota, and New Mexico, along with Hawaii and North Dakota.
- Four of the worst jurisdictions on this indicator—Louisiana, Mississippi, South Carolina, and West Virginia—are in the South. Other jurisdictions in the bottom ten include the District of Columbia, Illinois, Ohio, Oklahoma, Nevada, and New Jersey.
As with the other types of cancer, mortality rates due to breast cancer vary widely by race and ethnicity (Table 6.2). Black women have the highest mortality rates from breast cancer (30.2 per 100,000 women), which is more than double the rate for Asian/Pacific Islander, Native American, and Hispanic women and considerably higher than the rate for white women (21.2 per 100,000). Asian/Pacific Islander women have the lowest mortality rate (11.3 per 100,000) from breast cancer. Fortunately, black women are also more likely than women overall to have had a mammogram; 85.6 percent of black women aged 50 and older report having had a mammogram in the past two years, compared with 80.9 percent of all women (see Table 6.3 below). Mortality rates from both breast and lung cancer among women from different racial and ethnic groups vary across states (Appendix Tables B6.2 and B6.3).
Table 6.2. Mortality and Incidence of Disease Among Women by Race and Ethnicity, United States
 Notes: Mortality rates include women of all ages and are age-adjusted to the 2000 U.S. standard population. Data on chlamydia are for women of all ages. For heart disease, AIDS, lung cancer, and breast cancer, all racial groups are non-Hispanic and Asians include Pacific Islanders. For chlamydia, only whites and blacks are non-Hispanic, and Asians do not include Pacific Islanders. Hispanics may be of any race or two or more races. Data are not available for those who identify with another race or with two or more races. Data for heart disease, lung, and breast cancer mortality are three-year (2011–2013) averages.
Sources: IWPR compilation of data from the Centers for Disease Control and Prevention 2015a, 2015b, and 2015c.
The racial and ethnic disparities in mortality from disease are alarming. Black women are considerably more likely than women of all other racial and ethnic groups to die from heart disease and breast cancer; black women have a rate of heart disease mortality that is more than double the rate for Asian/Pacific Islander women, the group with the best rate, and a breast cancer mortality rate than is nearly triple the rate for Asian/Pacific Islander women. White women have the second worst mortality rate from both of these diseases. In addition, white and black women have the highest rates of lung cancer mortality; the rate for white women is three times that of Hispanic women, the group with the best rate, and the rate for black women is more than two and a half times the rate for Hispanic women (Table 6.2). These striking disparities indicate that much more needs to be done to reduce the very high rates of mortality from disease, especially among black and white women who generally have the highest mortality rates.
Diabetes
Women and men with diabetes are considerably more likely than those without it to develop heart disease or stroke, blindness, kidney disease, and other serious health conditions (Centers for Disease Control and Prevention 2011a). In the United States overall, 10.0 percent of women and 10.4 percent of men aged 18 and older report having been told they have diabetes (Table 6.1; IWPR 2015b).
- Among the 50 states and the District of Columbia, Colorado (5.9 percent), Alaska (6.6 percent), and Utah (6.8 percent) have the smallest percentages of women living with diabetes. Other states in the top ten include Connecticut, Idaho, Minnesota, Montana, New Hampshire, North Dakota, and Vermont.
- Alabama (14.1 percent), Mississippi (13.7 percent), and South Carolina (13.4 percent) have the largest percentages of women living with diabetes. In general, the South fares poorly on this indicator. Five other states from this region are among the ten states with the worst rankings: Georgia, Louisiana, North Carolina, Tennessee, and West Virginia. Delaware and New York are also among the bottom ten states.
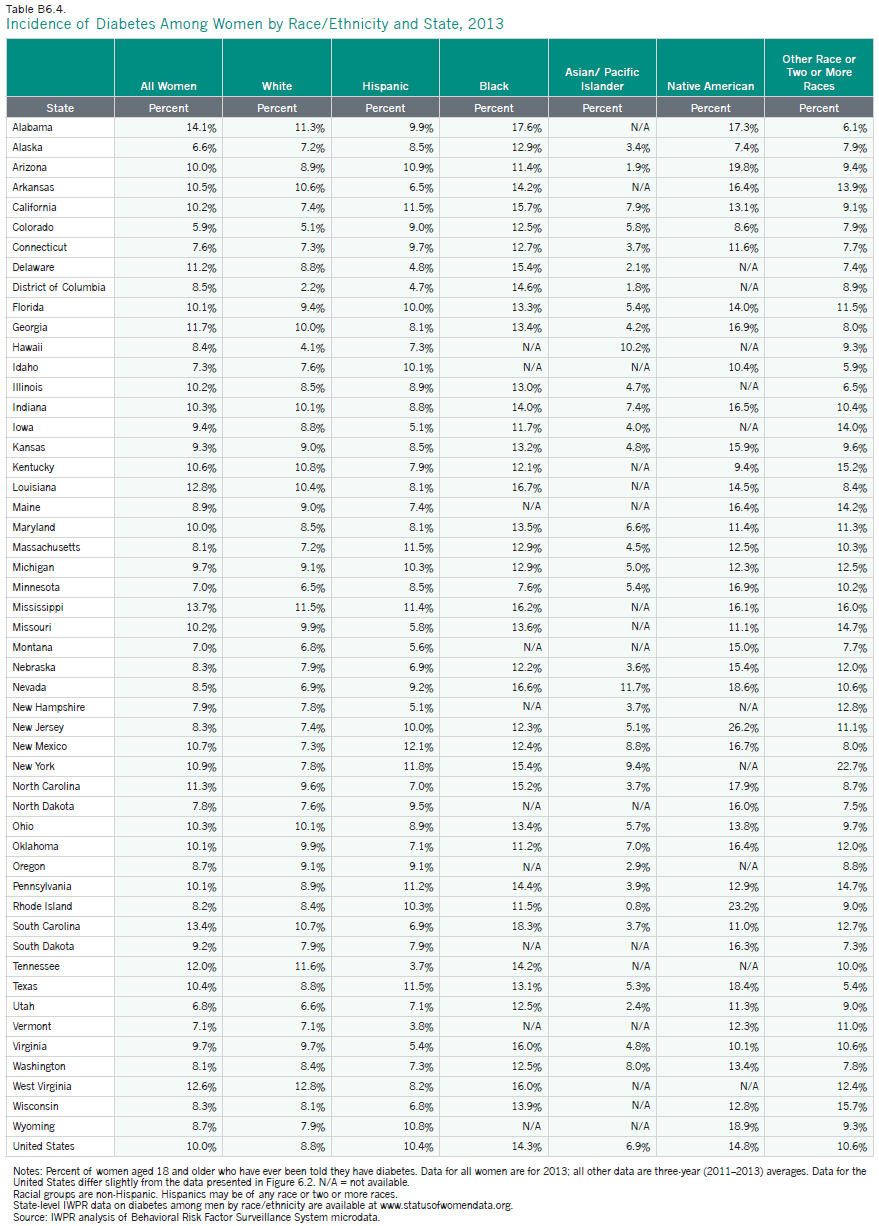
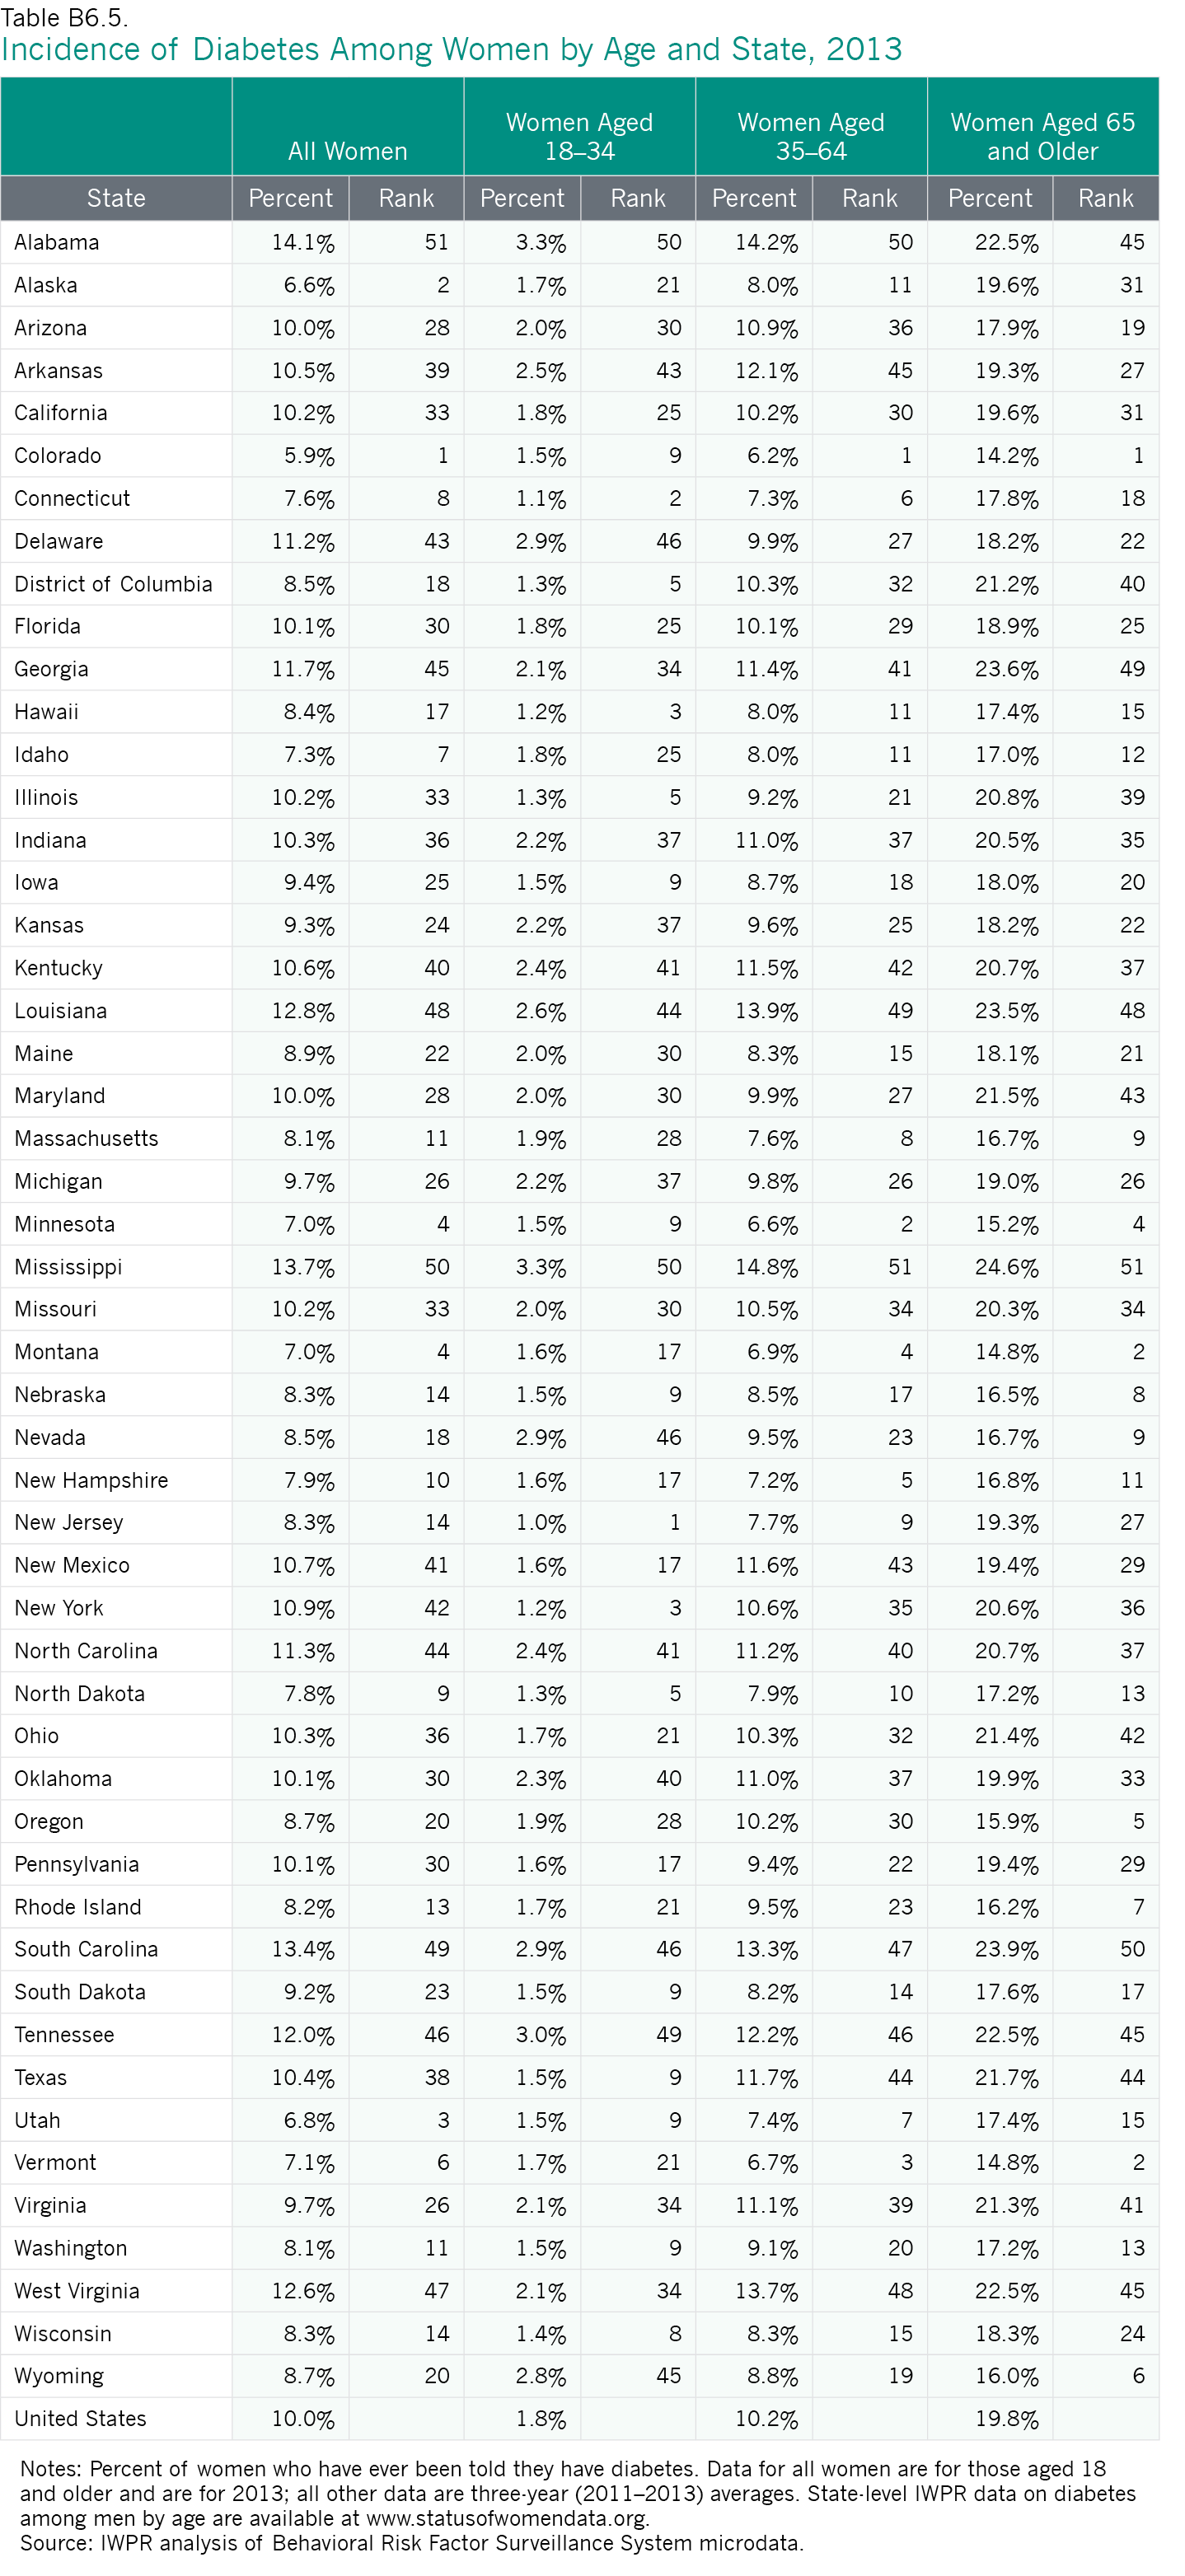
Rates of diabetes vary by age and among the largest racial and ethnic groups (Appendix Tables B6.4 and B6.5). In the United States overall, black and Native American women have the highest rates of diabetes (15.1 and 14.9 percent, respectively) and are twice as likely as Asian/Pacific Islander women, who have the lowest rate (7.5 percent), to have ever been told they have diabetes (Figure 6.2). One study that analyzed 2010–2012 data from the National Health Interview Survey found that among Hispanic adults, the rate of diagnosed diabetes was highest among Puerto Ricans (14.8 percent) and Mexican Americans (13.9 percent; data not available by gender), and lowest among Central and South Americans (8.5 percent) and Cubans (9.3 percent; Centers for Disease Control and Prevention 2014b). Among Asians, the rate was highest for those who identify as Indian (13.0 percent) or Filipino (11.3 percent) and lowest for those who are of Chinese descent (4.4 percent; Centers for Disease Control and Prevention 2014b).
Figure 6.2. Percent of Women and Men Who Have Ever Been Told They Have Diabetes by Race and Ethnicity, United States, 2013
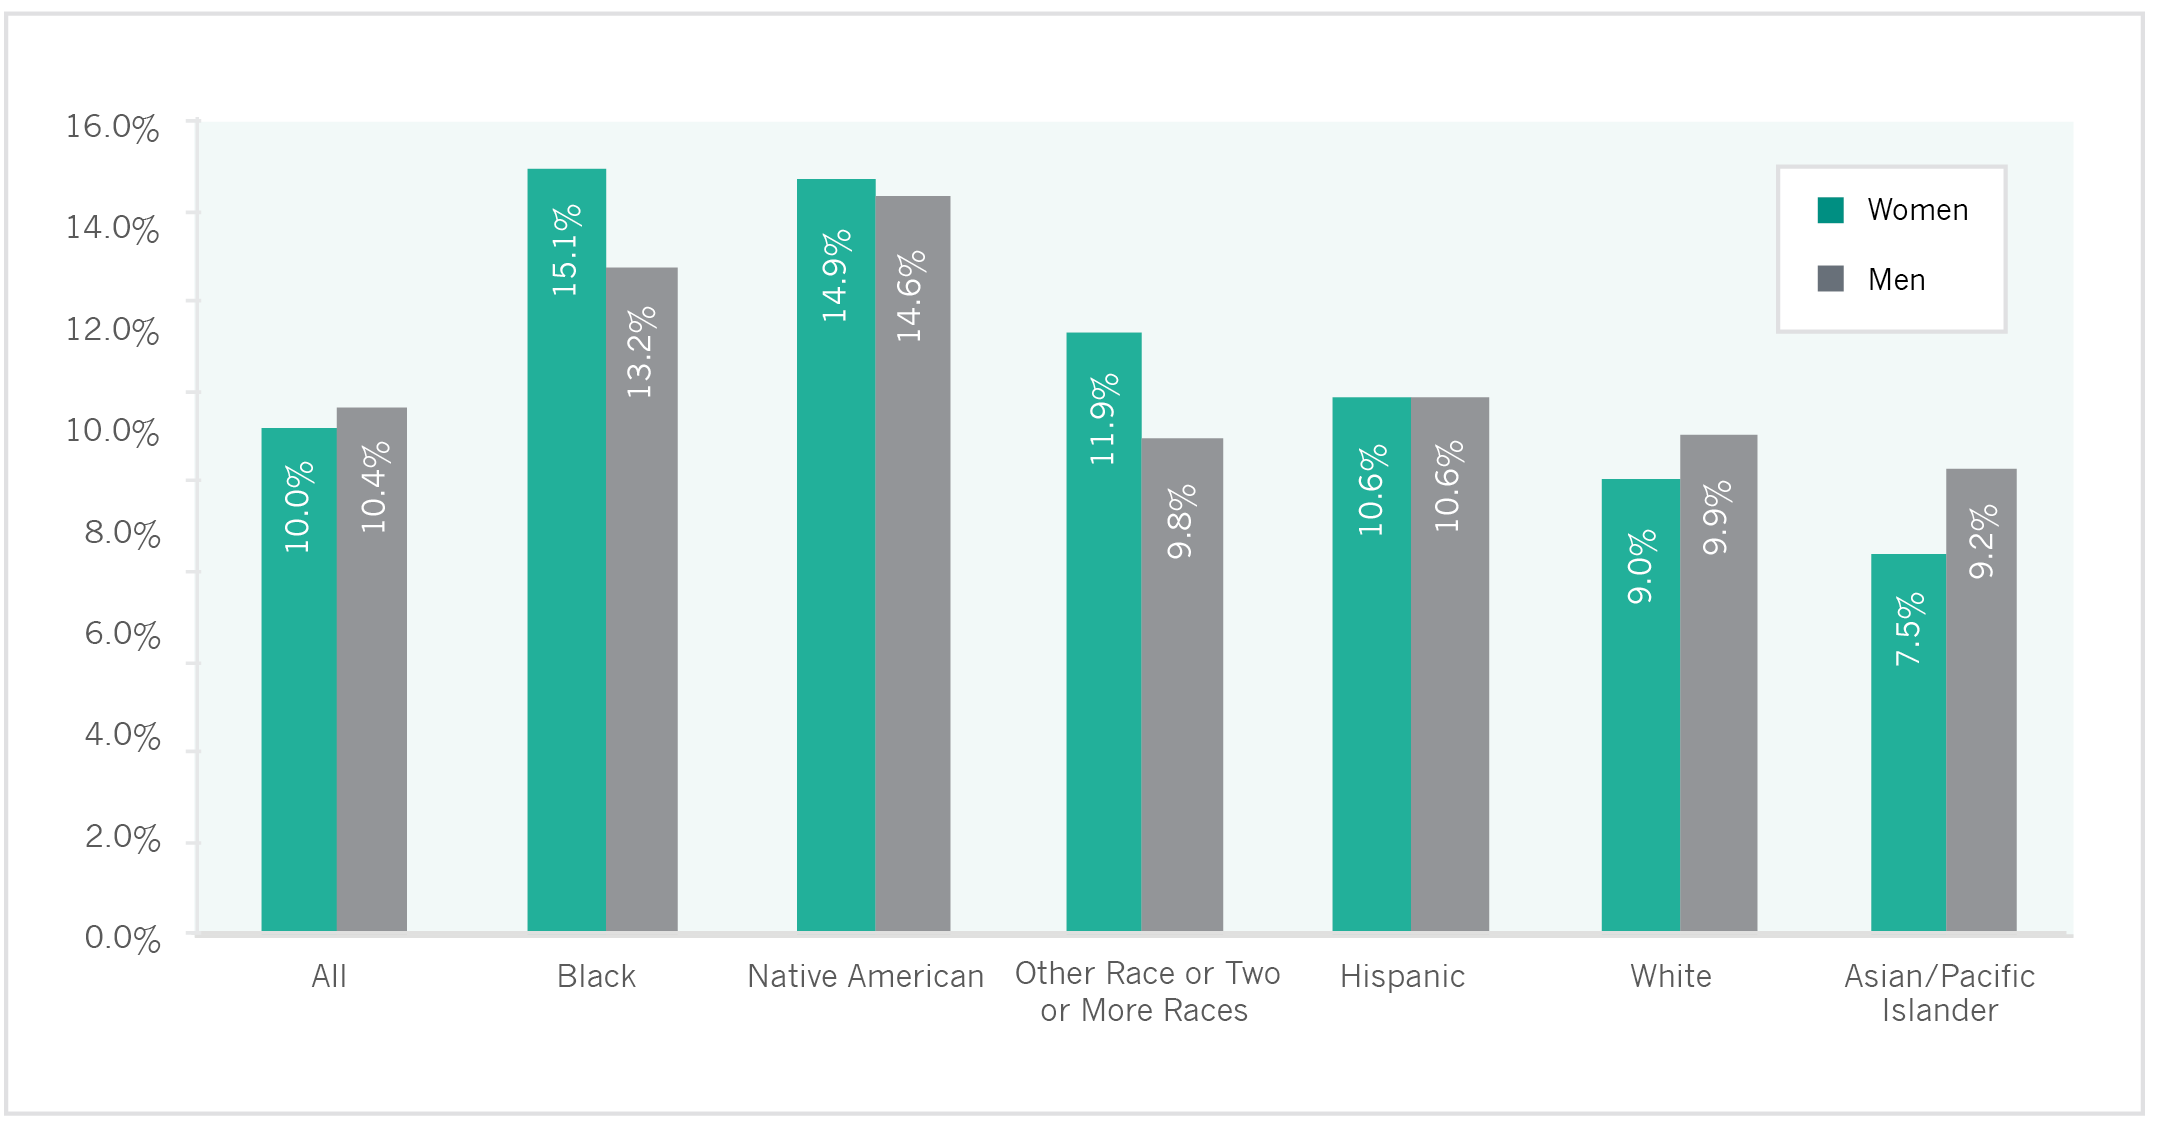 Note: Aged 18 and older.
Source: IWPR analysis of 2013 Behavioral Risk Factor Surveillance System microdata.
HIV/AIDS
Although the majority of individuals in the United States with HIV infections and newly diagnosed AIDS cases are men, women—particularly women of color—are also profoundly affected by HIV/AIDS. In the nation overall in 2010, there were 9,500 new diagnoses of HIV among female adolescents and adults; in 2011, there were 8,102 new AIDS diagnoses among adolescent and adult women (Kaiser Family Foundation 2014a).7 Young women (aged 25–34) comprise the largest share of new HIV infections among women (29 percent), followed by women aged 35–44 (25 percent) and aged 13–24 (22 percent; Kaiser Family Foundation 2014a).
Nationally, the incidence rate for AIDS among adolescent and adult women was 4.8 per 100,000 in 2012 (Table 6.1) compared with 15.3 per 100,000 among adolescent and adult men (Centers for Disease Control and Prevention 2015b). The incidence of AIDS has declined from 9.1 per 100,000 women in 2001 to 4.8 per 100,000 in 2012 (IWPR 2004; Table 6.1). The rate for men also declined during this time period (Centers for Disease Control and Prevention 2015b).
- The rate of AIDS among adolescent and adult women (aged 13 and older) is lowest in Vermont (0.0 per 100,000), North Dakota (0.4 per 100,000), and Montana (0.5 per 100,000).
- The AIDS rate among adolescent and adult women in the District of Columbia (47.6 per 100,000), the jurisdiction with the highest rate, is more than three times as high as the rates of the second and third worst-ranking jurisdictions, Georgia (14.8 per 100,000) and Louisiana (14.0 per 100,000). The District of Columbia also ranked last in the 2004 rankings.
- Many of the states with the best AIDS incidence rates are in the Midwest or Mountain West. In addition to Montana and North Dakota, five other states in these regions—Idaho, Nebraska, New Mexico, South Dakota, and Wyoming—rank among the top ten states. Hawaii, New Hampshire, and Vermont are also in the top ten.
- The states with the worst AIDS incidence rates are all in the South or the Mid-Atlantic regions. Delaware, the District of Columbia, Florida, Georgia, Louisiana, Maryland, Mississippi, New Jersey, New York, and South Carolina all rank in the bottom ten on this indicator.
- In 40 states and the District of Columbia, the rate of AIDS among adolescent and adult women has declined between 2001 and 2012. Despite its poor ranking on this indicator, the District of Columbia is one of the jurisdictions with the greatest improvement, with an incidence rate that declined by nearly half, from 92.0 per 100,000 in 2001 to 47.6 per 100,000 in 2012 (IWPR 2004; Table 6.1).
The rate of AIDS among black women in the United States (27.5 per 100,000) is higher than for any other racial and ethnic group and is nearly six times the rate for all women (4.8 per 100,000). Asian/Pacific Islander and white women have the lowest incidence rates (0.9 and 1.2 per 100,000, respectively; Table 6.2).
While there continues to be no cure for HIV/AIDS, the medical community has made significant advances in the treatment of HIV and AIDS, with the introduction of antiretroviral drugs that can suppress the HIV virus and slow the progression of the disease (Anderson et al. 2015). These medications have helped reduce the number of deaths from AIDS, yet early detection remains critical. The CDC recommends that persons at high risk for HIV be screened at least annually, and that HIV screening be included in routine prenatal screening tests for pregnant women (U.S. Preventive Services Task Force 2013).
- The District of Columbia, which has the highest AIDS incidence rate among adolescent and adult women, also has the highest percentage of women aged 18 and older who have ever been screened for HIV, at 66.2 percent.8 The proportion of women who reported having been screened in the District of Columbia was almost 20 percentage points higher than the next two jurisdictions with the best rankings for HIV screenings, Alaska (46.4 per 100,000) and Maryland (46.3 per 100,000). Many of the states with the highest incidence rates of AIDS are also among the states with the highest screening rates (Table 6.1; IWPR 2015b).
- In 2013, Utah had the lowest rate of women aged 18 and older who reported having ever been screened for HIV (24.9 percent). Many of the states with the lowest proportions of women who say they have been screened are also among states with the lowest AIDS incidence rates (Table 6.1; IWPR 2015b).
The percentage of women who have ever been screened for HIV also varies considerably across racial and ethnic groups. According to IWPR analysis of 2013 Behavioral Risk Factor Surveillance System microdata, approximately 60.7 percent of black women in the United States report having been screened, compared with 50.8 percent of Hispanic women, 45.0 percent of Native American women, 33.3 percent of Asian/Pacific Islander women, 32.5 percent of white women, and 51.3 percent of women who identify as multiracial or with another racial group (IWPR 2015b).
Older Women’s Health
As women age, they are more likely to experience chronic health conditions (Crescioni et al. 2010; Robinson 2007) and limitations in activities of daily living (Kaiser Family Foundation 2013b). Many older women do not have a spouse or relative who can provide the care they need, in part because women have a longer life expectancy than men (U.S. Census Bureau 2012), often marry men who are older than they are, and are less likely than men to remarry following divorce or spousal death (Livingston 2014). Older women’s lower likelihood of having a spouse, combined with their greater health care needs and larger share of the elderly population, means that they have higher average expenditures for home health care services and long-term care than men (Robinson 2007).
- Among older women, as among all women, heart disease is the leading cause of death (American Heart Association 2013). The mortality rate from heart disease is 266.6 per 100,000 for women aged 65–74 and 879.8 per 100,000 for women aged 75–84. The rate for women aged 85 and older is 3,732.9 per 100,000 (Centers for Disease Control and Prevention 2015a).
- Women’s mortality rate from breast cancer also increases as they age. Women aged 55–64 have a breast cancer mortality rate of 44.1 per 100,000, compared with 68.4 per 100,000 for women aged 65–74, 104.4 per 100,000 for women aged 75–84, and 173.0 per 100,000 for women aged 85 and older (Centers for Disease Control and Prevention 2015a).
- In the United States overall, slightly less than half (47.8 percent) of older women—those aged 65 and older—report that they get at least 150 minutes of physical activity per week outside of their jobs, a similar proportion to women overall (48.2 percent) but a lower proportion than older men (55.1 percent). Older women in Oregon are the most likely to get this amount of exercise (62.2 percent), and older women in Mississippi are the least likely (30.8 percent).
- Women aged 65 and older are about as likely as women overall to report that they eat at least five servings of fruits or vegetables per day (20.4 percent of older women and 19.9 percent of all women say they eat this amount of fruits and vegetables). Older women are the most likely to say they eat five or more fruits or vegetables if they live in California (30.6 percent) or Oregon (27.6 percent) and least likely to do so if they live in Louisiana (9.8 percent) or Tennessee (10.2 percent).
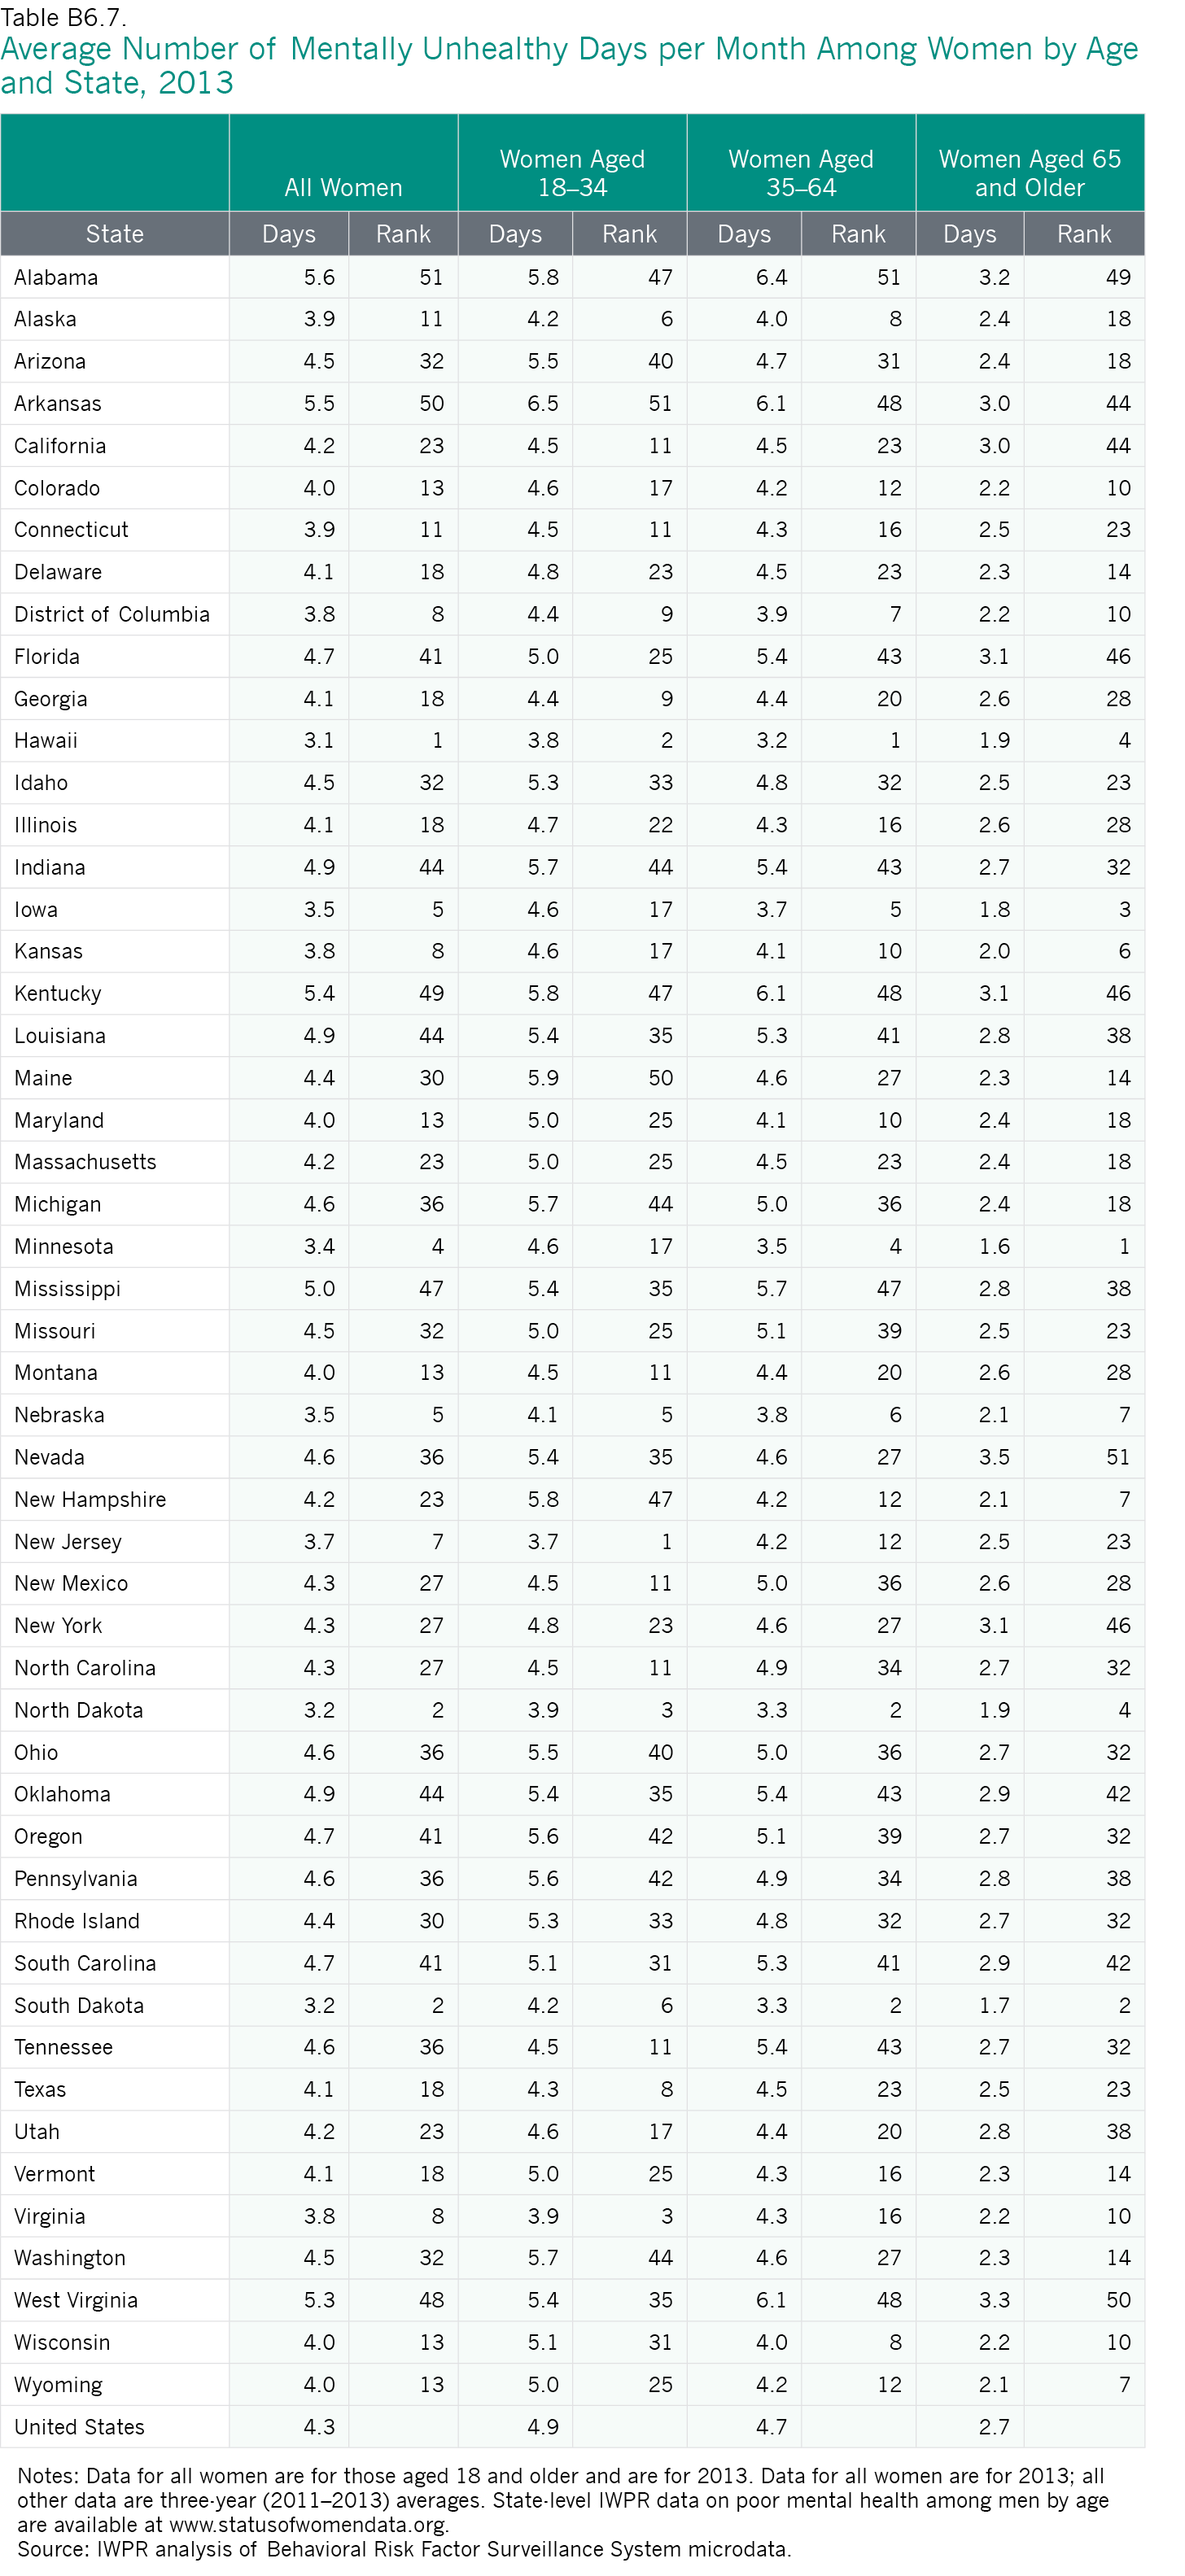
- Older women in the United States also report having a higher average number of days of poor mental health per month than older men (2.7 compared with 2.0) but a lower number than women overall (4.3). Among older women, the average number of days of poor mental health per month is largest in Nevada (3.5) and West Virginia (3.3), and smallest in Minnesota (1.6) and South Dakota (1.7; Appendix Table B6.7).
- Six in ten women aged 65 and older (60.0 percent) are overweight or obese, compared with 72.1 percent of older men and 57.6 percent of women overall. Two-thirds of older women are overweight or obese in Louisiana (65.8 percent) and Michigan (65.5 percent), the states with the highest proportions. In Hawaii, the state with the smallest proportion, fewer than half of older women (44.4 percent) are overweight or obese (Appendix Table B6.11).
- One in five women aged 65 and older in the United States (19.8 percent) report having diabetes. Among older women, incidence of diabetes is highest in Mississippi (24.6 percent), South Carolina (23.9 percent), and Georgia (23.6 percent), and lowest in Colorado (14.2 percent) and in Montana and Vermont (14.8 percent each; Appendix Table B6.5).
- In the United States overall, older women report an average of 5.7 days per month on which their activities are limited by their health status, compared with 4.8 days for women aged 18 and older and 6.2 days for older men. Older women in North Dakota and Maine report having the smallest numbers of days of limited activities, and older women in West Virginia and Tennessee report having the most (Appendix Table B6.9).
Given older women’s lower socioeconomic status, tendency to experience more chronic health conditions than men, and greater longevity, the financing of their health care is an especially important issue. Medicare, the federal health program that provides health coverage to Americans aged 65 and older and younger adults with permanent disabilities, is a key source of health insurance for older women. More than half (56 percent) of all older Medicare recipients are women, and women constitute two-thirds of Medicare beneficiaries aged 85 and older (Kaiser 2013b). Medicare helps cover the costs of a range of basic medical care services, but the program has important gaps in coverage and charges relatively high cost-sharing that can result in higher out-of-pocket expenses for recipients (National Partnership for Women and Families 2012). Among Medicare beneficiaries, women have higher expenses than older men, with the difference in out-of-pocket expenses the largest among women and men aged 85 and older ($7,555 for women and $5,835 for men; Kaiser 2013b). The average out-of-pocket expenditures for older women who receive Medicare increase with age (Kaiser 2013b), which means that the highest expenditures come as some women’s financial resources are becoming more limited or depleted.
The Affordable Care Act includes some provisions that address the gaps in Medicare coverage. In addition to the ACA’s coverage of annual wellness visits and some preventive benefits that previously required co-pays—a financial barrier for many older women with low incomes and limited financial resources in retirement—the legislation begins to close a gap in coverage for prescription drugs that some individuals who use Medicare’s Part D drug benefit encounter and will fully close the gap by 2020 (National Partnership for Women and Families 2012). In addition, the ACA created the Center for Medicare and Medicaid Innovation to support the development and testing of new payment and service delivery models that improve the quality of care and lower costs. It also funds hospitals and community-based groups to provide transitional care services (from a hospital to home or another care facility) to high-risk beneficiaries to help make these transitions smoother and safer (National Partnership for Women and Families 2012). Since older women are more likely than older men to be Medicare recipients and to require transitional care services, these changes will especially benefit older women.
Data other than heart disease and breast cancer are based on IWPR analysis of Behavioral Risk Factor Surveillance System microdata (IWPR 2015b and 2015c). BRFSS data for the United States overall are for 2013; all other data are three-year averages (2011–2013).
Sexual Health
National data show that women are more likely than men to be diagnosed with a sexually transmitted infection, or STI (U.S. Department of Health and Human Services 2012a). Women are biologically more susceptible to certain STIs than men (Centers for Disease Control and Prevention 2011b). In addition, women visit the doctor more often—and, therefore, may be more likely to be screened for STIs (Centers for Disease Control and Prevention 2011b). As with many other health problems, education, awareness, and proper screening can limit the spread of STIs and diminish their health impact.
One of the more common STIs among women is chlamydia. In 2013, there were 993,348 reported cases of chlamydia among women of all ages in the United States, with the largest number in the South (412,537; Centers for Disease Control and Prevention 2015c). While approximately 75 percent of women and 50 percent of men with chlamydia do not experience symptoms (Centers for Disease Control and Prevention n.d.), the infection can lead to Pelvic Inflammatory Disease (PID), a common cause of infertility, miscarriage, and ectopic pregnancy (Centers for Disease Control and Prevention 2014c). Screening for chlamydia is, therefore, important to women’s overall reproductive health.
Among women, young women aged 20–24 have the highest rates of chlamydia with a rate of 3,621.1 per 100,000, followed by young women aged 15–19 (3,043.3 per 100,000). The rate for women aged 25–29 (1428.3 per 100,000) is less than half the rate of women aged 20–24. The rates of infection are lower in older age groups (Centers for Disease Control and Prevention 2014d).
Incidence rates of chlamydia vary widely among states (Table 6.1).
- The District of Columbia has the highest rate of chlamydia among women at 1197.8 per 100,000, followed by Alaska (1113.3 per 100,000). Both jurisdictions have incidence rates that are more than three times as high as the rate of the best-ranking state, New Hampshire (327.2 per 100,000).
- In general, states in the South fare worst on this indicator. Alabama, Arkansas, Louisiana, Mississippi, North Carolina, and South Carolina are all in the bottom ten. Alaska, Delaware, the District of Columbia, and New Mexico are in this bottom group as well.
- In addition to New Hampshire, three New England states—Maine, Massachusetts, and Vermont—are among the ten states with the lowest chlamydia incidence rates in 2013. Three states from the Mountain West region—Idaho, Utah, and Wyoming—also rank in the best ten, as do Minnesota, New Jersey, and West Virginia.
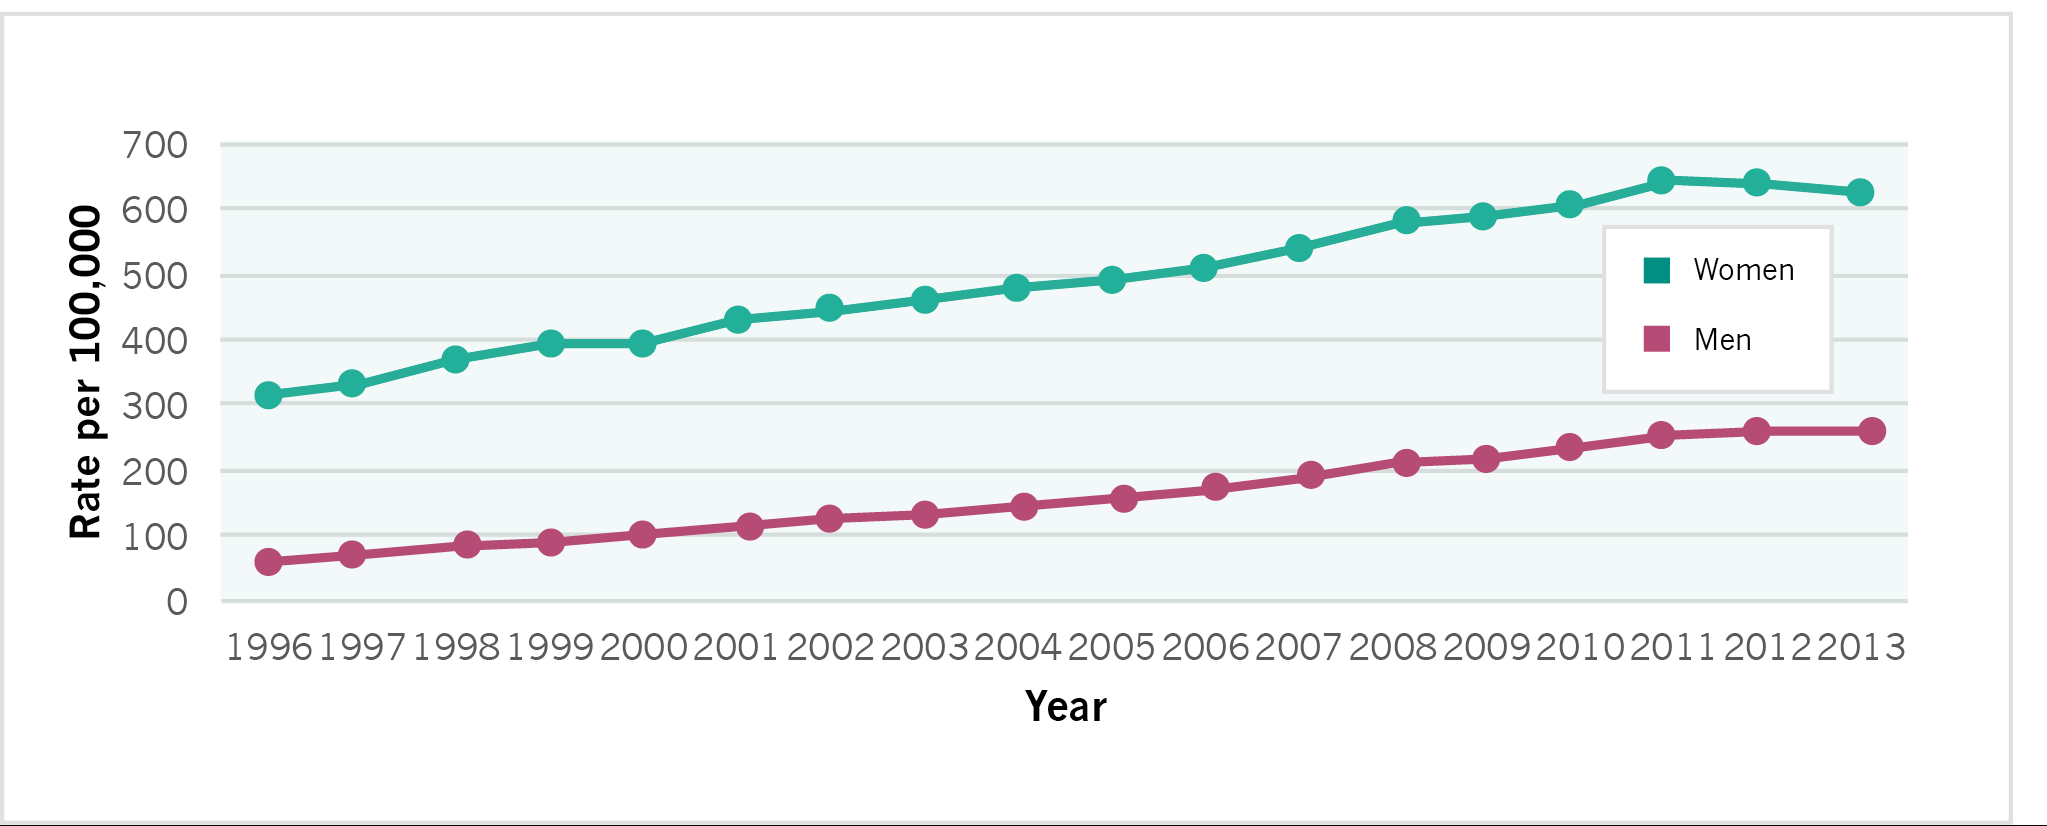
Between 2002 and 2012, the incidence of chlamydia increased in every state and the District of Columbia (IWPR 2004; Table 6.1). Between 1996 and 2013, the national incidence of chlamydia nearly doubled, increasing from 315.5 per 100,000 women to 623.1 per 100,000 (Figure 6.3). During this time, the incidence of chlamydia among men increased from 59.8 to 262.6 per 100,000; Figure 6.3).
Note: Includes women and men of all ages.
Source: IWPR compilation of data from the Centers for Disease Control and Prevention 2015d.
Among the largest racial and ethnic groups, black women have the highest incidence rate of chlamydia (1491.7 per 100,000 women), followed by Native American women (1079.2 per 100,000). Asian/Pacific Islander women have the lowest rate at 154.6 per 100,000 (Table 6.2), which is nearly ten times lower than the rate among black women.
Mental Health
Women have higher incidences than men of certain mental health conditions, including anxiety, depression, and eating disorders (Eaton et al. 2012). Multiple factors may contribute to women’s greater likelihood of experiencing such conditions, including higher rates of poverty (Heflin and Iceland 2009), greater responsibility in caring for disabled or ill family members (Cannuscio et al. 2002), and trauma from gender-based violence (Rees et al. 2011).
Poor Mental Health
Analysis of data from the 2013 Behavioral Risk Factor Surveillance System indicates that adult women in the United States—when asked to think about their mental health, including stress, depression, and problems with emotions—report having an average of 4.3 days per month on which their mental health is not good (Table 6.1). The number of poor mental health days that women report experiencing is higher than the average number of poor mental health days per month reported by men (3.3; IWPR 2015b).
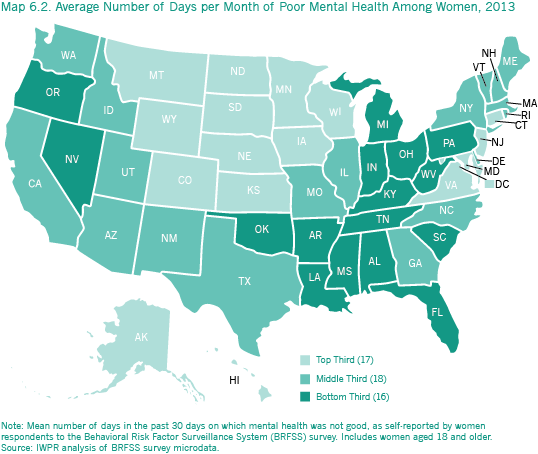
- Women’s self-reported number of days per month of poor mental health is lowest in Hawaii at 3.1 days per month, followed by North Dakota and South Dakota (3.2 days each).
- Alabama has the highest self-reported average number of days per month of poor mental health among women at 5.6, followed by Arkansas (5.5 days) and Kentucky (5.4 days).
- The Midwest fares the best on this indicator; in addition to North and South Dakota, four states in this region—Iowa, Kansas, Minnesota, and Nebraska—are in the top ten. The District of Columbia, Hawaii, New Jersey, and Virginia are also in this best-ranking group.
- The South fares the worst on this indicator. In addition to Alabama, Arkansas, and Kentucky, five Southern states—Florida, Louisiana, Mississippi, South Carolina, and West Virginia—are all in the bottom eleven. Indiana, Oklahoma, and Oregon (which tied for 41st place along with Florida and South Carolina) are also in this worst-ranking group.
- Between 2000 and 2013, the average number of days on which women experienced poor mental health increased in all but five states—New Mexico, Texas, Virginia, Wisconsin, and Wyoming—and the District of Columbia.
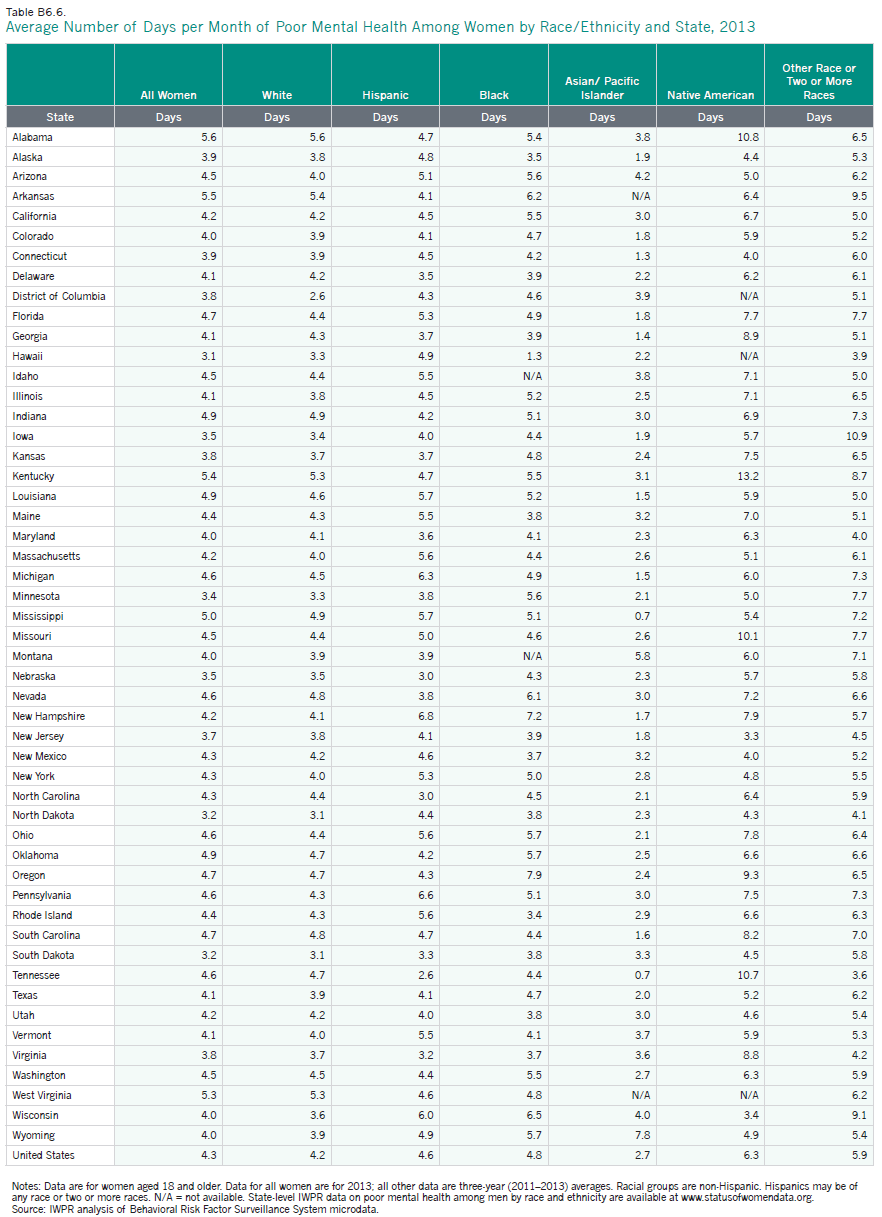
Among women from the largest racial and ethnic groups, Native American women report having, on average, the most number of days per month of poor mental health (6.3; Appendix Table B6.6), followed by women who identify with another racial group or two or more races (5.9 days), black women (4.8 days), Hispanic women (4.6 days), and white women (4.2 days). Asian/Pacific Islander women report having the fewest days per month of poor mental health (2.7 days on average).
Suicide
Suicide is another public health problem related to mental health that poses a serious concern for many communities. In the United States, women are much less likely than men to commit suicide but more likely to have suicidal thoughts (Crosby et al. 2011) and to attempt suicide (McIntosh and Drapeau 2014). In 2011, there were an estimated 987,950 suicide attempts in the United States; women were three times more likely to attempt suicide than men (McIntosh and Drapeau 2014). During this same year, there were 8,515 deaths from suicide among women and 31,003 among men (McIntosh and Drapeau 2014).
The national suicide rate is 5.4 per 100,000 for women (Table 6.1) and 20.2 per 100,000 for men (Centers for Disease Control and Prevention 2015e).
- Among women, the District of Columbia had the lowest suicide mortality rate between 2011 and 2013 at 3.1 per 100,000, followed by New Jersey (3.2 per 100,000) and Maryland (3.5 per 100,000). Other best ten states include California, Connecticut, Illinois, Massachusetts, Nebraska, New York, and Rhode Island.
- Montana had the highest female mortality rate from suicide in 2011–2013 at 10.8 per 100,000, followed by New Mexico (10.0 per 100,000) and Wyoming (9.2 per 100,000). The suicide rates among women are highest in the Mountain West region; all the states in this region—Arizona, Colorado, Idaho, Montana, New Mexico, Nevada, Utah, and Wyoming—are among the worst ten states. Alaska and Oregon are also a part of the worst-ranking group.
Certain populations have higher rates of suicide or attempted suicide. One recent report that analyzed data from the U.S. National Transgender Discrimination Survey (NTDS), conducted by the National Gay and Lesbian Task Force and the National Center for Transgender Equality, found that lifetime suicide attempts by transgender individuals are far higher than among the total population (Haas, Rodgers, and Herman 2014). Forty-two percent of transgender women and 46 percent of transgender men report having attempted suicide at some point in their lifetime.
Suicide rates also vary across the largest racial and ethnic groups. Among women in the United States, Native American and white women have the highest suicide rates at 7.9 and 7.1 per 100,000, more than three times the rate of the two groups with the lowest rates, Hispanic and black women (Figure 6.4).
Figure 6.4. Suicide Mortality Rates Among Women (per 100,000) by Race and Ethnicity, United States, 2013
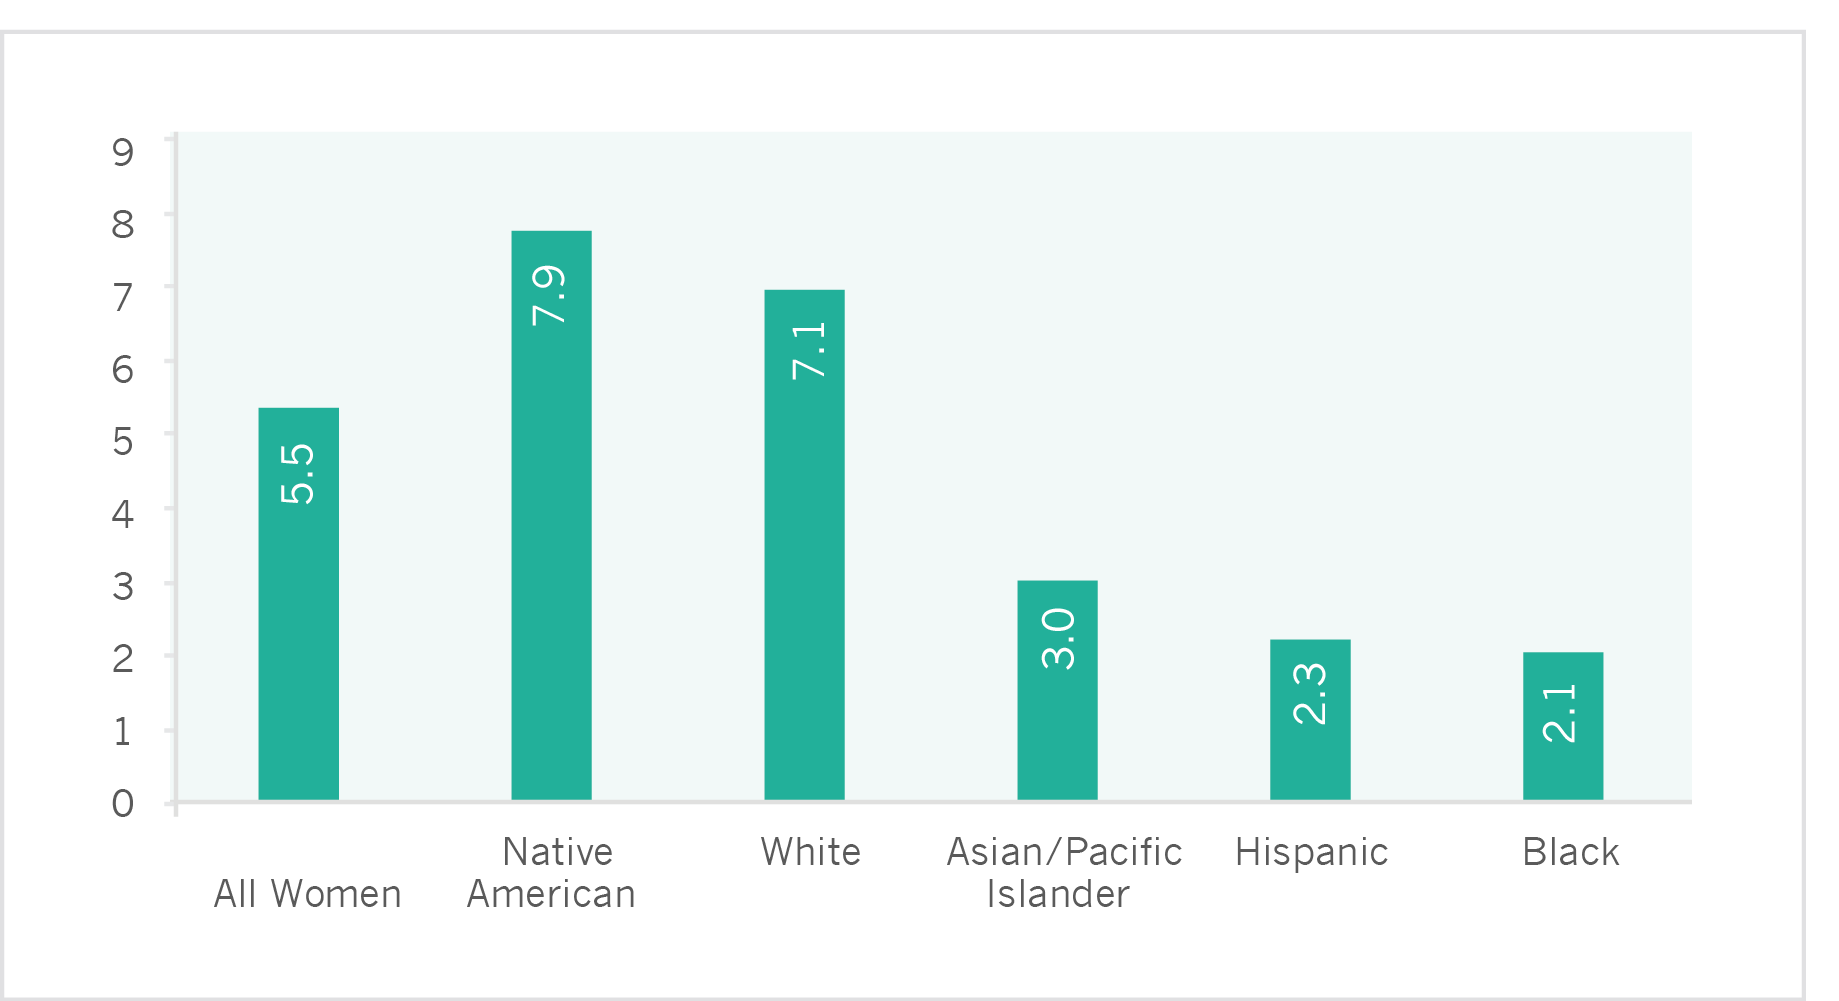
Notes: Data include women of all ages and are age-adjusted to the 2000 U.S. standard population. Racial categories are non-Hispanic. Hispanics may be of any race.
Source: IWPR compilation of data from the Centers for Disease Control and Prevention (2015e).
Limitations on Women’s Activities
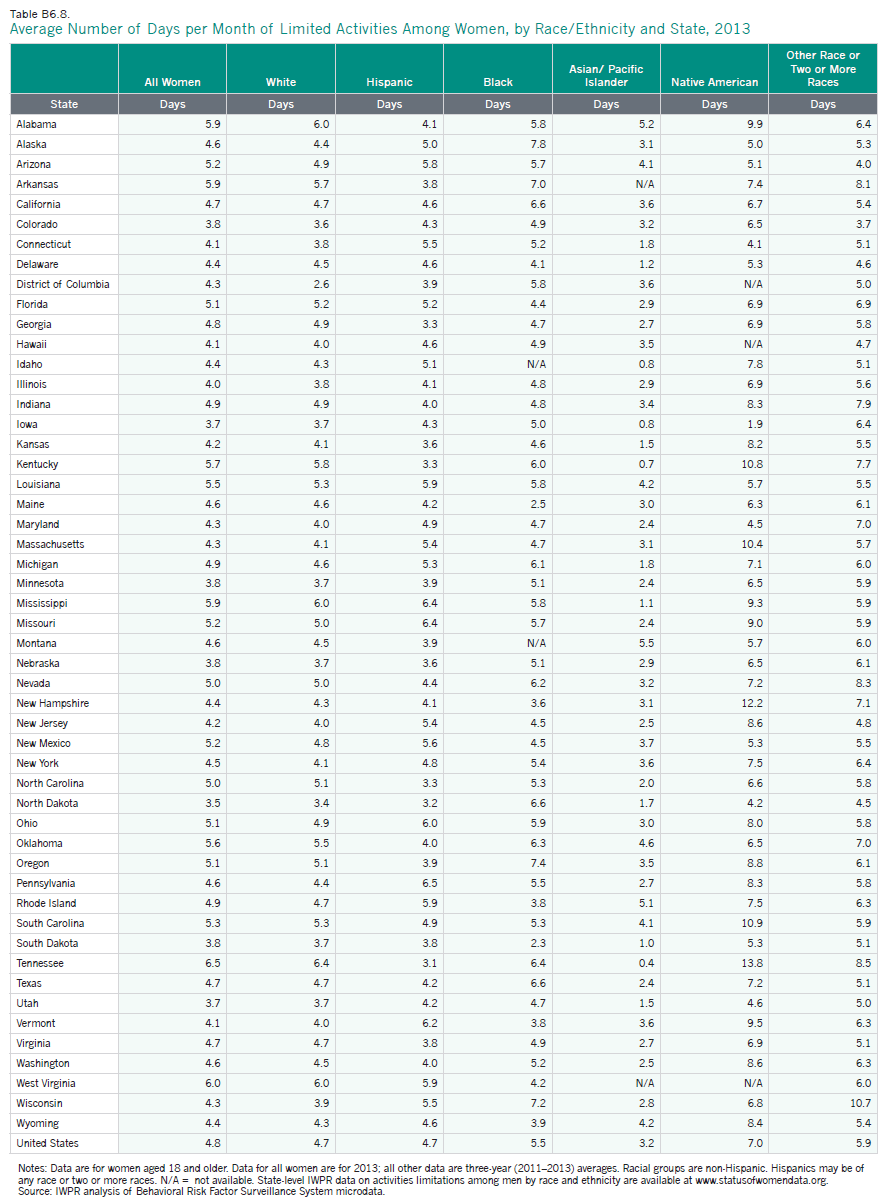
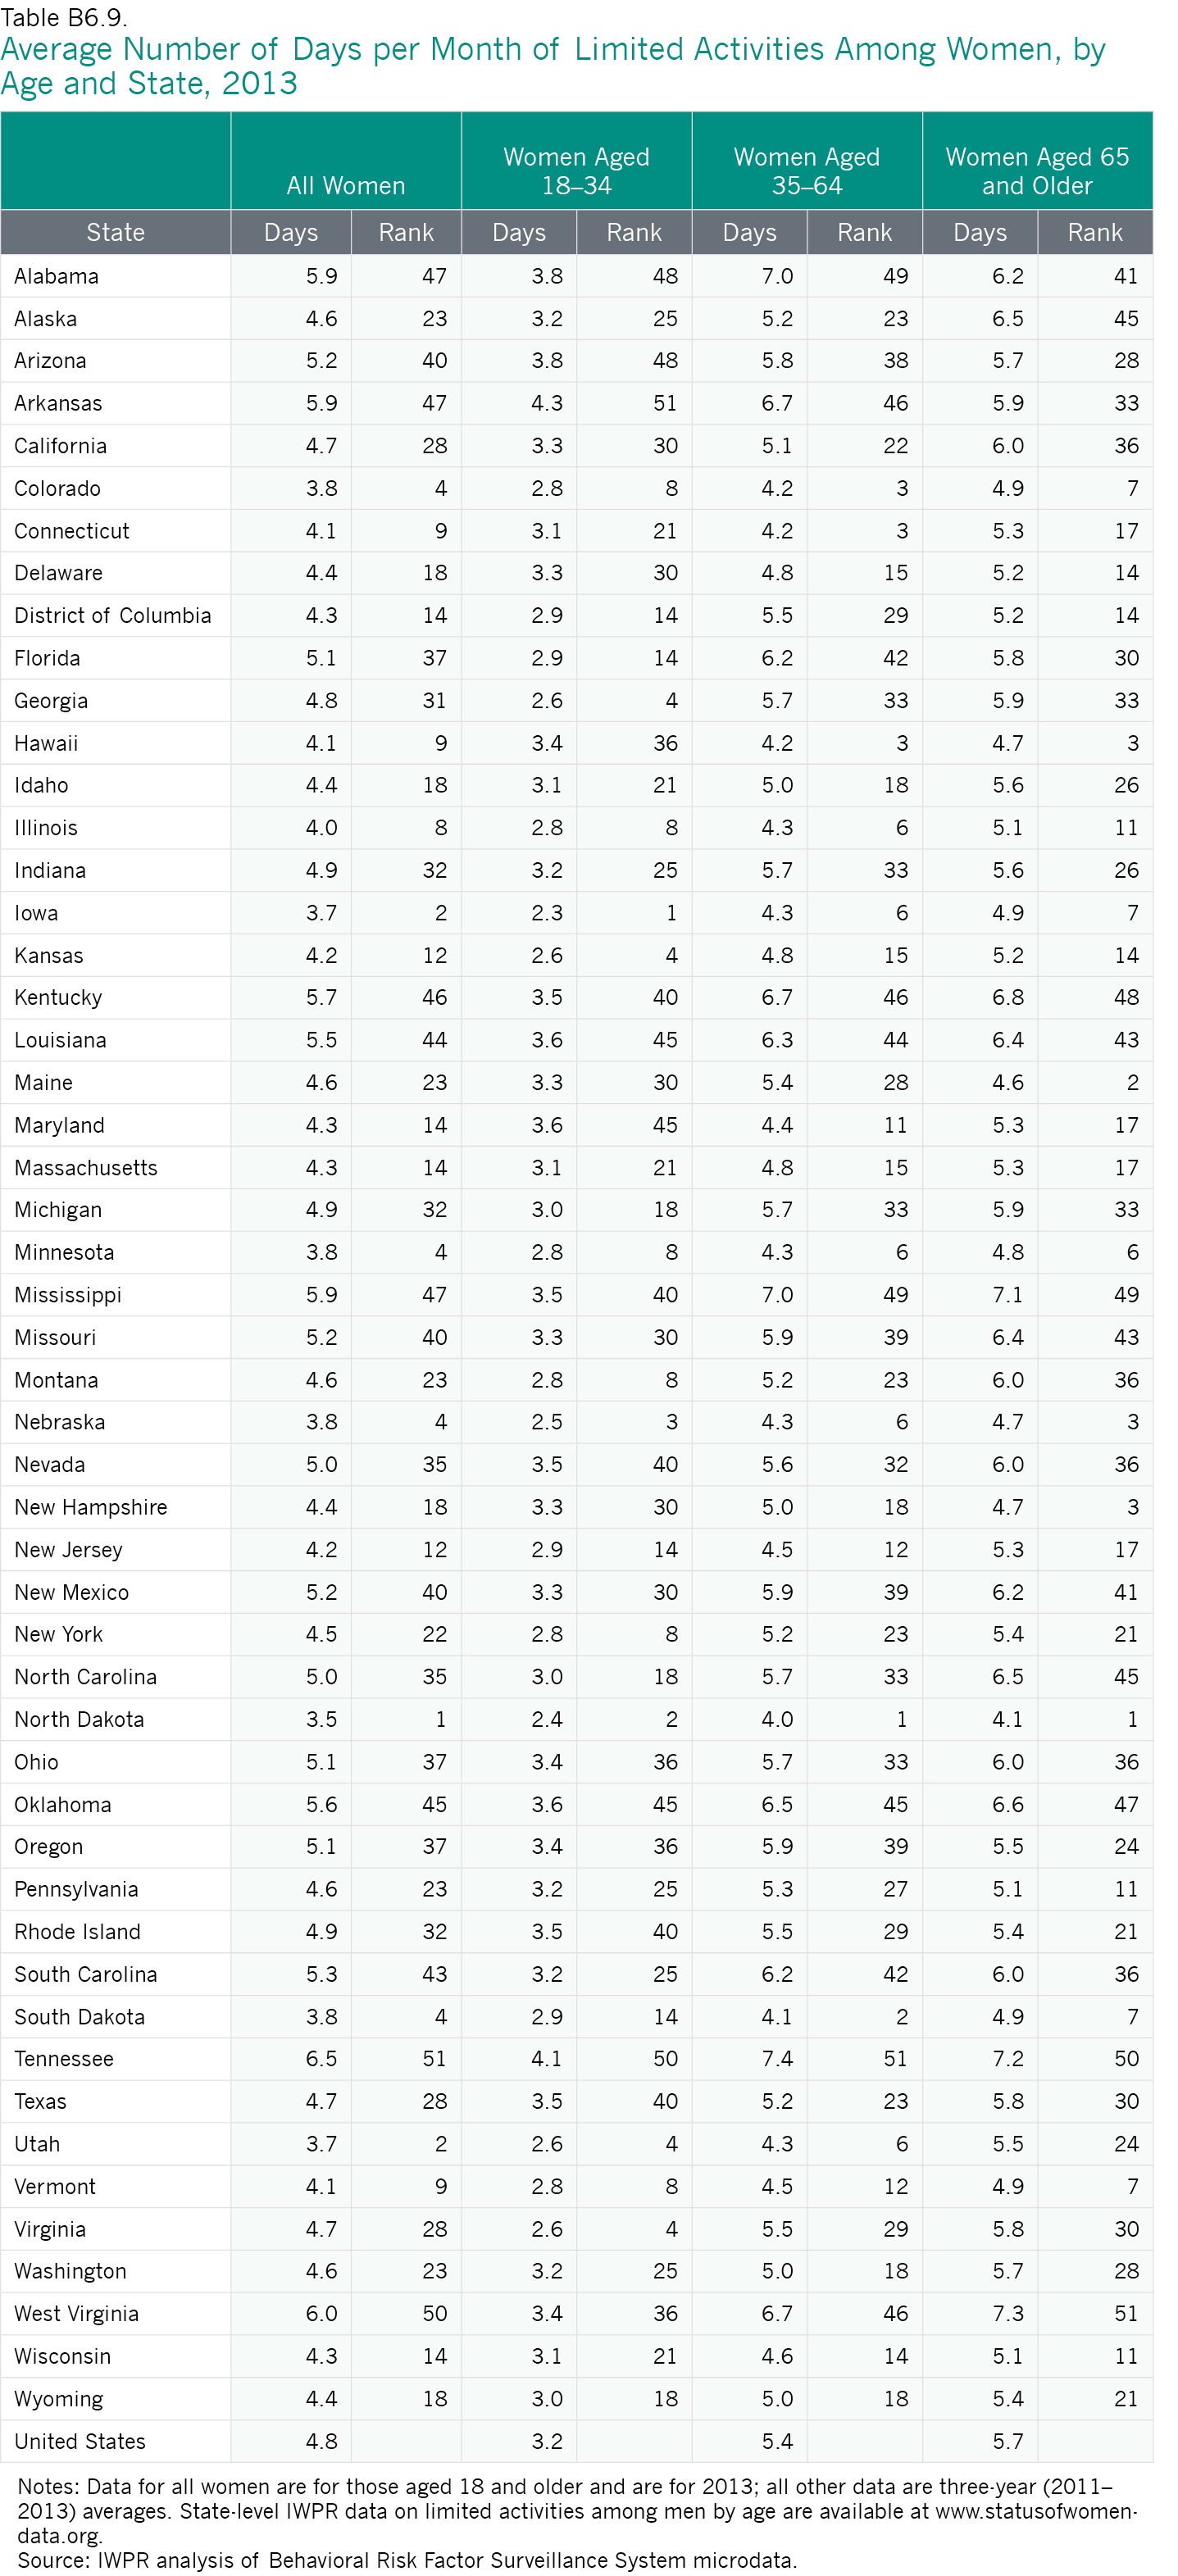
Illness, disability, and overall poor health make it difficult for women to thrive at home and in the workplace. IWPR analysis indicates that women aged 18 and older who participated in the Centers for Disease Control and Prevention’s 2013 Behavioral Risk Factor Surveillance System survey reported that their activities were limited by their health status for an average of 4.8 days in the month preceding the survey (Table 6.1).
- Women in North Dakota report having the fewest days per month during which their activities were limited, at 3.5 days. Five other Midwestern states—Illinois, Iowa, Minnesota, Nebraska, and South Dakota—rank in the top eleven on this indicator. Colorado, Connecticut, Hawaii, Utah, and Vermont are also among the states with the best rankings. Connecticut, Hawaii, and Vermont tied for ninth place with an average of 4.1 days of poor mental health per month.
- Women in Tennessee report the most days of activities limitations per month at 6.5 days. Seven other Southern states—Alabama, Arkansas, Kentucky, Louisiana, Mississippi, South Carolina, and West Virginia—are in the bottom twelve. Arizona, Missouri, and New Mexico, all tied for 40th place, are also in the worst-ranking group, along with Oklahoma.
| Best and Worst States on Activities Limitations Among Women | |||||
| State |
Days per Month Activities Limited by Health Status | Rank |
State |
Days per Month Activities Limited by Health Status |
Rank |
| North Dakota | 3.5 | 1 | Tennessee | 6.5 | 51 |
| Iowa | 3.7 | 2 | West Virginia | 6.0 | 50 |
| Utah | 3.7 | 2 | Alabama | 5.0 | 47 |
| Colorado | 3.8 | 4 | Arkansas | 5.9 | 47 |
| Minnesota | 3.8 | 4 | Mississippi | 5.9 | 47 |
| Nebraska | 3.8 | 4 | |||
| South Dakota | 3.8 | 4 | |||
Among women from the largest racial and ethnic groups, Native American women have the highest self-reported average number of days per month of activities limitations at 7.0, more than double the average number of days for Asian/Pacific Islander women, who have the least (3.2; Appendix Table B6.8). For all racial and ethnic groups, the self-reported number of days of limited activities among women varies considerably across states (Appendix Table B6.8).
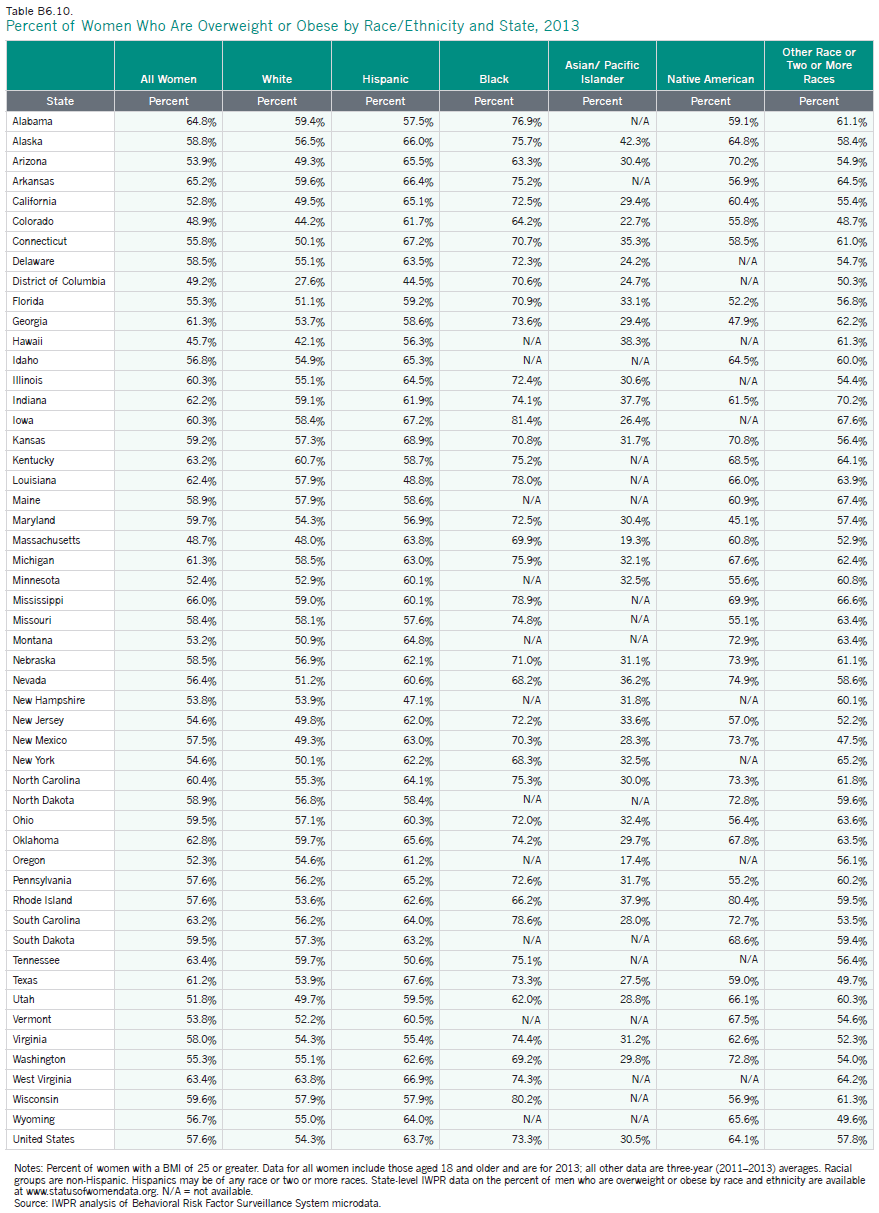
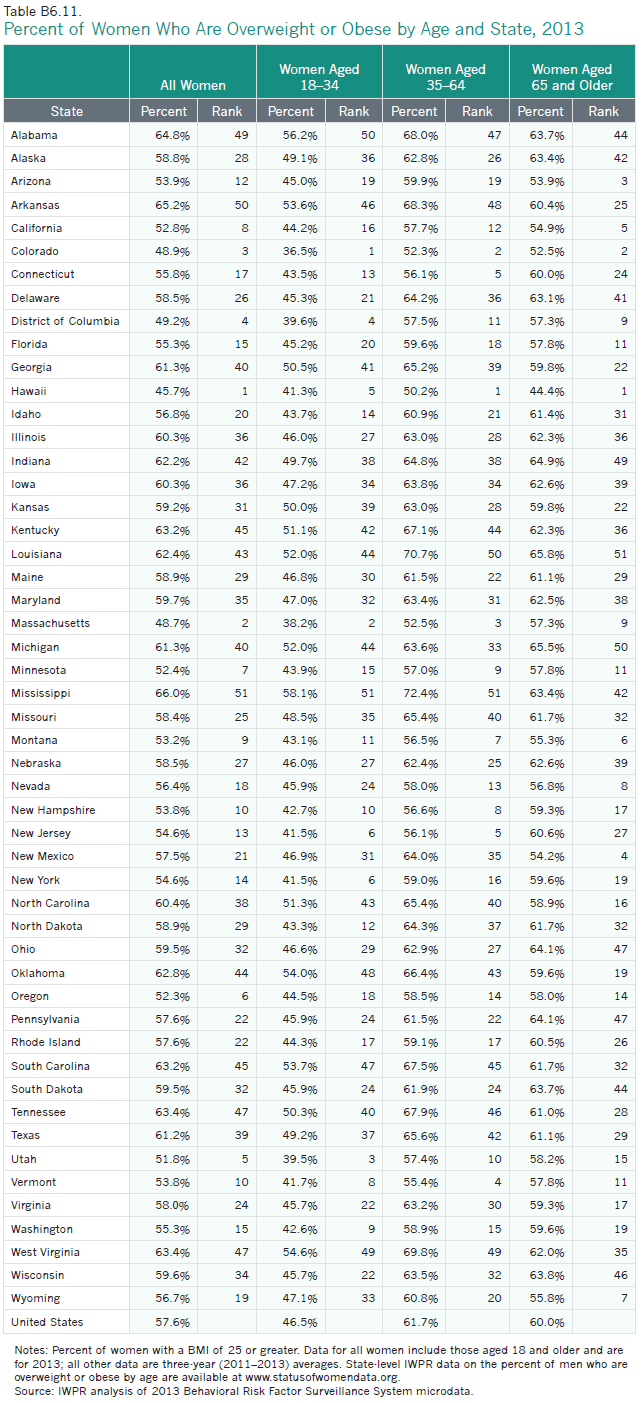
Obesity and Healthy Weight
Being overweight or obese is a growing health concern for women in the United States. Nationally, nearly six in ten women (57.6 percent) aged 18 and older are overweight or obese (classified as having a body mass index of 25 or greater; Appendix Tables B6.10 and B6.11).
Overweight and obesity rates vary across the states.
- Hawaii (45.7 percent), Massachusetts (48.7 percent), and Colorado (48.9 percent) have the smallest proportions of women who are overweight or obese. Other jurisdictions in the best ten are California, the District of Columbia, Minnesota, Montana, Oregon, Utah, and Vermont.
- Two-thirds of women (66.0 percent) in the state with the worst ranking, Mississippi, are overweight or obese; Arkansas and Alabama have the second and third largest proportions of women who are overweight or obese at 65.2 and 64.8 percent, respectively. In general, the South fares poorly on this indicator; in addition to Mississippi, Arkansas, and Alabama, five Southern states—Kentucky, Louisiana, South Carolina, Tennessee, and West Virginia—are in the bottom ten. Indiana and Oklahoma are also in the worst-ranking group.
Among women from the largest racial and ethnic groups, black women in the United States overall are the most likely to be overweight or obese at 73.3 percent, followed by Native American women (64.1 percent), Hispanic women (63.7 percent), and white women (54.3 percent). Asian/Pacific Islander women are the least likely to be overweight or obese (30.5 percent). For each racial and ethnic group, the percentage of women who are overweight or obese varies considerably across states (Appendix Table B6.10).
The Health Status of LGBT Women
LGBT women face health disparities that may stem from a variety of factors, including the stresses of being part of a sexual minority, societal stigma toward the LGBT community, barriers to accessing health insurance, and outright denial of care due to sexual orientation or gender nonconforming behavior (Grant et al. 2011; Institute for Medicine 2011; Lick et al. 2013; Ranji et al. 2014).
- LGBT women (29 percent) are more likely than LGBT men (21 percent) and non-LGBT women and men (19 and 15 percent, respectively) to say that they did not have enough money for health care needs at least once in the past year (Gates 2014).
- Bisexual women aged 18 and older are more than twice as likely as heterosexual women of the same age range to report consuming five or more alcoholic drinks in one day at least once in the past year (33.8 percent compared with 14.3 percent). Lesbian women also are more likely than heterosexual women to report having had at least five alcoholic drinks in one day in the past year, although the difference is not as large (25.8 percent compared with 14.3 percent; Ward et al. 2014).
- Lesbian (25.7 percent) and bisexual women (28.5 percent) aged 18 and over are more likely than heterosexual women (15.0 percent) to be current cigarette smokers (Ward et al. 2014).
- Among women aged 20 and older, lesbian (36.7 percent) and bisexual women (40.9 percent) are considerably more likely to be obese than heterosexual women (28.3 percent; Ward et al.2014).
- One study analyzing Gallup-Healthways Well-Being Index data found that LGBT women are considerably more likely than non-LGBT women (29 percent compared with 16 percent) to report that they do not have a personal doctor. Among LGBT and non-LGBT men, the difference is not significant (29 percent and 27 percent, respectively; Gates 2014).
- Analysis of data from one survey of nearly 5,000 LBGT individuals in the United States found that more than half (nearly 56 percent) of respondents reported having faced discrimination in a health care setting, including being refused needed care, having a health care professional use excessive precautions or refuse to touch them, being blamed for their health status, or having a health care professional use harsh or abusive language toward them (Lambda Legal 2010). Such discrimination may mean that LGBT women do not receive the care they need.
- Research indicates that lesbian and bisexual women aged 18 and older are less likely than heterosexual women to describe their health as excellent or very good (53.4 percent and 55.5 percent, respectively, compared with 59.8 percent; Ward et al. 2014). Among men, the pattern differs: those who identify as gay are the most likely to say their health is excellent or very good (66.2 percent, compared with 63.6 percent of bisexual men and 61.6 percent of heterosexual men).
- Lesbian and bisexual women aged 18 and older are more likely than heterosexual women to report having experienced serious psychological distress in the past 30 days. Approximately 10.9 percent of bisexual women and 5.3 percent of lesbian women say they have recently experienced serious distress, compared with 4.2 percent of heterosexual women (Ward et al. 2014).
- LGBT youth are more likely to experience mood and anxiety disorders, depression, and suicidal ideation and attempts than their non-LGBT counterparts (Institute for Medicine 2011). Analysis of Youth Risk Behavior Surveys conducted between 2001 and 2009 found that across nine jurisdictions—Delaware, Maine, Massachusetts, Rhode Island, Vermont, Boston, Chicago, New York City, and San Francisco—the prevalence of attempted suicide among high school students during the 12 months before the survey ranged from 3.8 to 9.6 percent (median: 6.4 percent) among heterosexual students, from 15.1 to 34.3 percent (median: 25.8 percent) among gay or lesbian students, from 20.6 to 32.0 percent (median: 28.0 percent) among bisexual students, and from 13.0 to 26.7 percent (median: 18.5 percent) among students who describe themselves as unsure of their sexual orientation (Kann et al. 2011).
- Transgender adults often face specific challenges to maintaining good health, including harassment and discrimination in medical settings, economic insecurity and lack of access to health insurance, refusal of care, and lack of knowledge among providers about the health care needs of transgender persons (Grant, Mottet, and Tanis 2011). Analysis of the National Transgender Discrimination Survey found that 19 percent of respondents reported having been refused care due to their transgender or gender nonconforming status, 28 percent said they had experienced verbal harassment in medical settings, and 50 percent reported having to teach their medical provider about transgender care. One in four respondents (26 percent) reported having used drugs or alcohol to cope with the impacts of discrimination (Grant, Mottet, and Tanis 2011).
The Affordable Care Act has made inroads in addressing some of these challenges. An analysis of Gallup-Healthways Well-Being Index data published in August 2014 indicated that the percentage of LGBT adults aged 18 and older without health insurance decreased after the ACA went into effect at the beginning of 2014; however, LGBT adults were still more likely than their non-LGBT counterparts to lack health insurance (17.6 percent of LGBT adults polled between January and June 2014 lacked coverage, compared with 13.2 percent of non-LGBT adults; Gates 2014). In addition to expanding access to coverage, the Affordable Care Act prohibits discrimination based on sex and gender identity in any health program receiving federal funds. The U.S. Department of Health and Human Services has issued additional regulations governing health insurance marketplaces and the plans sold in them that prohibit discrimination on the basis of sexual orientation (U.S. Department of Health and Human Services 2012b).
Preventive Care and Health Behaviors
Practicing preventive health care and maintaining good health behaviors are important components of women’s health and overall well-being.
- In the United States as a whole, fewer than half of women aged 18 and older (48.2 percent) report exercising at least 150 minutes per week. Oregon (64.6 percent), Colorado (59.1 percent), and Vermont (59.0 percent) have the largest proportions of women who say they get this much exercise. The states with the smallest proportions of women who report exercising at least 150 minutes per week are Mississippi (33.1 percent), Tennessee (34.7 percent), and Arkansas (38.1 percent; IWPR 2015b).
- Only 20.6 percent of women aged 18 and older in the United States say they eat five or more servings of fruits and vegetables every day. Women in West Virginia, Tennessee, and Mississippi are the least likely to eat this amount of fruits and vegetables daily, and women in California, Oregon, and Vermont are the most likely. Even in the best ranking state, California, nearly seven in ten women do not eat at least five servings of fruits and vegetables per day (IWPR 2015b).
- Nationally, fewer than one in six adult women (15.8 percent) report that they have smoked 100 or more cigarettes in their lifetime and now smoke every day or some days. Utah has the smallest proportion of women who smoke at 9.2 percent, and West Virginia has the largest (26.5 percent; IWPR 2015b). Overall, the percentage of women in the United States who report smoking has declined considerably since 2000, when 21.2 percent of women said they had smoked 100 or more cigarettes in their lifetime and smoke every day or some days (IWPR 2002).
- About one in nine (11.2 percent) women aged 18 and older report binge drinking (having consumed four or more drinks on at least one occasion during the preceding month). The percentage of women who report binge drinking in the District of Columbia, which fares the worst on this indicator, is more than three times that of West Virginia, which fares the best (18.7 in the District of Columbia compared with 5.7 percent in West Virginia; IWPR 2015b).
- Nearly four in five (79.5 percent) women aged 18 and older in the United States report having had a pap test in the past three years (Table 6.3). Women in the District of Columbia, Massachusetts, and Maryland are the most likely to say they have had a pap test. Women in Idaho, Montana, and Oklahoma are the least likely to report having done so (IWPR 2015b).9
- Approximately four in five (80.9 percent) women in the United States aged 50 and older report having had a mammogram in the past two years. Massachusetts (89.5 percent), the District of Columbia (86.3 percent), and Rhode Island (86.2 percent) have the largest shares of women who have had a breast cancer screening. Wyoming (70.6 percent), Idaho (72.4 percent), and Oklahoma (73.4 percent) have the smallest shares (IWPR 2015b).
Health behaviors and preventive care also vary by race and ethnicity. Among women aged 18 and older, white women are the most likely to exercise at least 150 minutes per week (51.0 percent), but have higher than average rates of smoking and are the second most likely to say they have engaged in binge drinking at least once in the preceding month (Table 6.3). Among women aged 50 and older, black women—who have the highest breast cancer mortality rate—and Asian/Pacific Islander women are the most likely to say that they have had a mammogram in the past two years. Among women aged 18 and older, Asian/Pacific Islander, black, and Hispanic women are the most likely to say they have had a pap test in the past three years. Black women are the most likely to have ever been tested for HIV (60.7 percent) and to have been screened for cholesterol in the past five years (65.8 percent; Table 6.3).
Table 6.3. Health Behaviors and Preventive Measures Among Women by Race and Ethnicity, United States
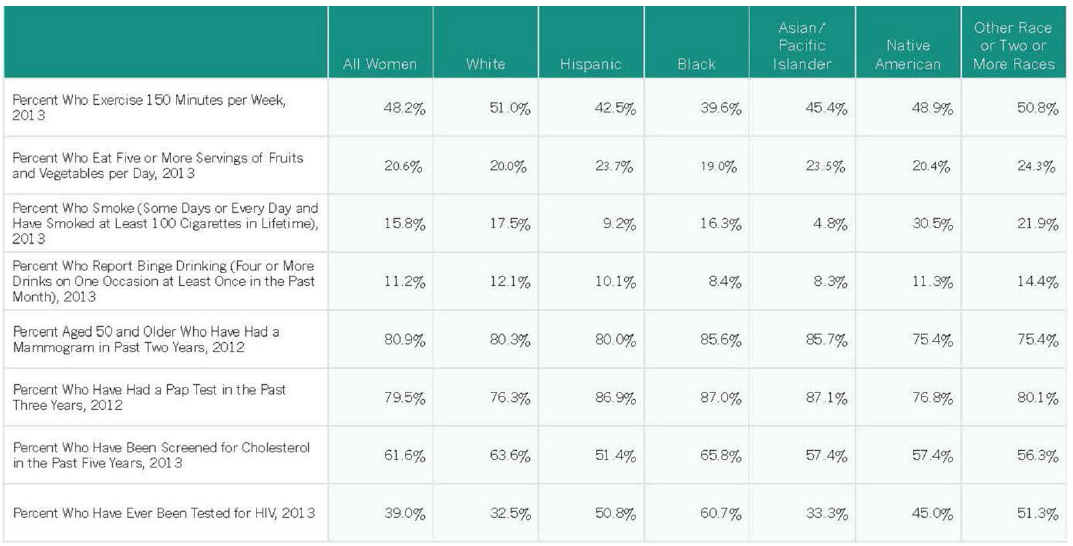 Notes: Data are for women aged 18 and older, except for the percent of women who have had a mammogram in the past two years. Racial groups are non-Hispanic. Hispanics may be of any race or two or more races.
Source: IWPR analysis of Behavioral Risk Factor Surveillance System microdata.
Millennial Women’s Health 10
Establishing good health behaviors and practicing preventive medical care is critical to millennial women’s ability to maintain good health as they age.
- Only about half (49.4 percent) of millennial women in the United States get at least 150 minutes per week of moderate or vigorous physical activity (such as running, calisthenics, gardening, or walking for exercise) outside of their jobs. Oregon has the largest percentage of young women who report getting this much exercise at 67.7 percent, and Tennessee has the smallest percentage at 35.5 percent.
- Approximately one in five millennial women (19.9 percent) report that they eat five or more servings of fruits and vegetables per day. Millennial women in Oregon are most likely to eat at least five servings of fruits and vegetables on a daily basis, but even in this best-ranking state only about 27 percent of young women consume this amount of fruits and vegetables. In West Virginia, the worst-ranking state, about one in ten young women (10.5 percent) report that they eat five or more servings of fruits and vegetables per day.
- One in five millennial women (20.0 percent) say they have engaged in binge drinking (defined for women as drinking four or more drinks on one occasion) in the past month. The percentage of women who have engaged in binge drinking varies from a low of 11.0 percent in Utah to a high of 31.6 percent in the District of Columbia. Nationally, more than one in three millennial men (35.0 percent) report having engaged in binge drinking (defined for men as drinking five or more drinks on one occasion).
- Millennial women report having, on average, 4.9 days per month of poor mental health, compared with 3.6 days for millennial men and 4.3 days for women overall. Millennial women report the highest average number of days per month of poor mental health in Arkansas (6.5) and the lowest in New Jersey (3.7; Appendix Table B6.7).
- Nearly half of young women (46.5 percent) in the United States are overweight or obese, defined as having a body mass index of 25 or greater. Young women are the most likely to be overweight or obese in Mississippi (58.1 percent), Alabama (56.2 percent), and West Virginia (54.6 percent). They are least likely to be overweight or obese in Colorado (36.5 percent), Massachusetts (38.2 percent), and Utah (39.5 percent; Appendix Table B6.11).
- More than nine in ten young women in the United States (94.0 percent) say they have had a pap test in the past three years. They are most likely to have had the test if they live in Massachusetts (97.6 percent), Iowa (96.7 percent), or Maryland (96.5 percent), and least likely to have done so if they live in Idaho and Arizona (87.0 percent each) or in Utah (89.7 percent).
Data are based on IWPR analysis of Behavioral Risk Factor Surveillance System microdata (IWPR 2015b and 2015c). Data for the United States overall are for 2013; all other data are three-year averages (2011–2013).
Conclusion
Some measures of women’s health status have shown signs of progress since the publication of IWPR’s 2004 Status of Women in the States report, but in other ways women’s health status has worsened. Women are less likely to die from heart disease, breast cancer, and lung cancer, but more likely to experience poor mental health, have their activities limited by their health status, and to be diagnosed with diabetes or chlamydia. In addition, the suicide mortality rate among women has increased. The implementation of the Affordable Care Act has changed the landscape of health care for women, providing more women access to preventive care and other services, yet some women continue to face barriers to obtaining the services they need. Ensuring that women have adequate access to preventive care, health care services and information about specific health conditions is integral to promoting the good health women need to work, pursue educational and career opportunities, achieve economic security, and maintain their overall well-being.
Appendix Tables
1Heart disease, breast cancer, and lung cancer data are three-year averages (1999–2001 and 2011–2013).
2In IWPR’s 2004 Status of Women in the States report, the U.S. totals for diabetes, poor mental health, and limited activities were reported as the median rather than the average; state data on these indicators were reported as averages. For comparison purposes, the U.S. totals on these indicators given in this section are also medians.
3Data collection procedures for the Behavioral Risk Factor Surveillance System survey—on which IWPR’s estimates of incidence of diabetes, poor mental health days, and days of limited activities are based—changed in 2011. See Methodology for more details.
4Individuals were previously eligible only if they were pregnant, the parent of a dependent child, 65 years of age or older, or disabled, in addition to meeting income requirements (National Conference of State Legislatures 2011).
5Federal law allows for the expansion of Medicaid to individuals with incomes at or below 133 percent of the federal poverty line. The law also includes a five percent “income disregard,” which effectively makes the limit 138 percent of poverty (Center for Mississippi Health Policy 2012).
6There are some exceptions; for example, states may waive the five-year waiting period for children and pregnant women who are lawfully residing in the United States and applying for benefits from Medicaid and Children’s Health Insurance program (CHIP). As of January 2015, 27 states and the District of Columbia covered otherwise ineligible immigrant children to some extent under this option, and 22 states and the District of Columbia covered otherwise ineligible pregnant women (Kaiser Family Foundation 2015b). The Affordable Care Act also permits immigrants who are ineligible for Medicaid due to the five-year ban to buy private insurance through the insurance
7AIDS diagnoses data include six U.S. dependent areas.
8State-by-state IWPR data on HIV screenings rates are available at www.statusofwomendata.org.
9IWPR state-level data on preventive care and health behaviors is available at www.statusofwomendata.org.
10“Millennials” here include women and men aged 18–34; analysis of the health of millennials is based on the Behavioral Risk Factor Surveillance System survey, which is conducted among adults in the United States aged 18 and older. This definition of millennials differs slightly from the definition in IWPR’s Status of Women in the States 2015: Employment and Earnings and Poverty and Opportunity reports, which defined millennials to include those aged 16–34.