Health & Well-Being

A
B
C
D to F

In this Section

Health & Well-Being

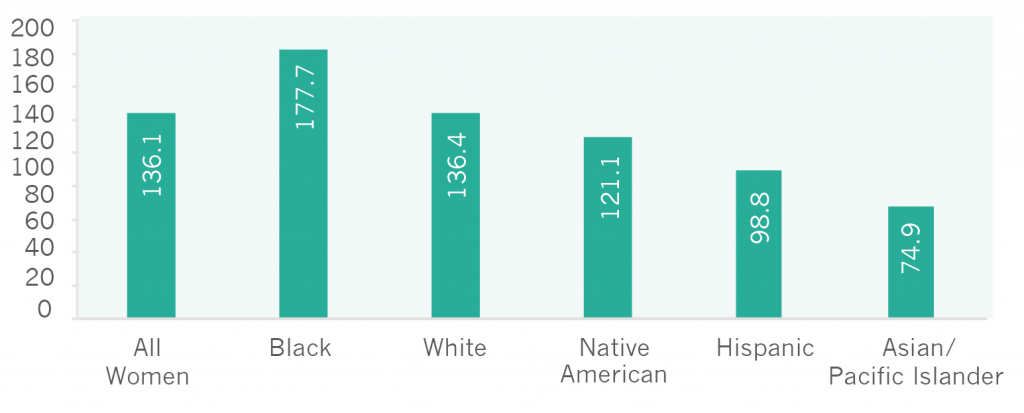
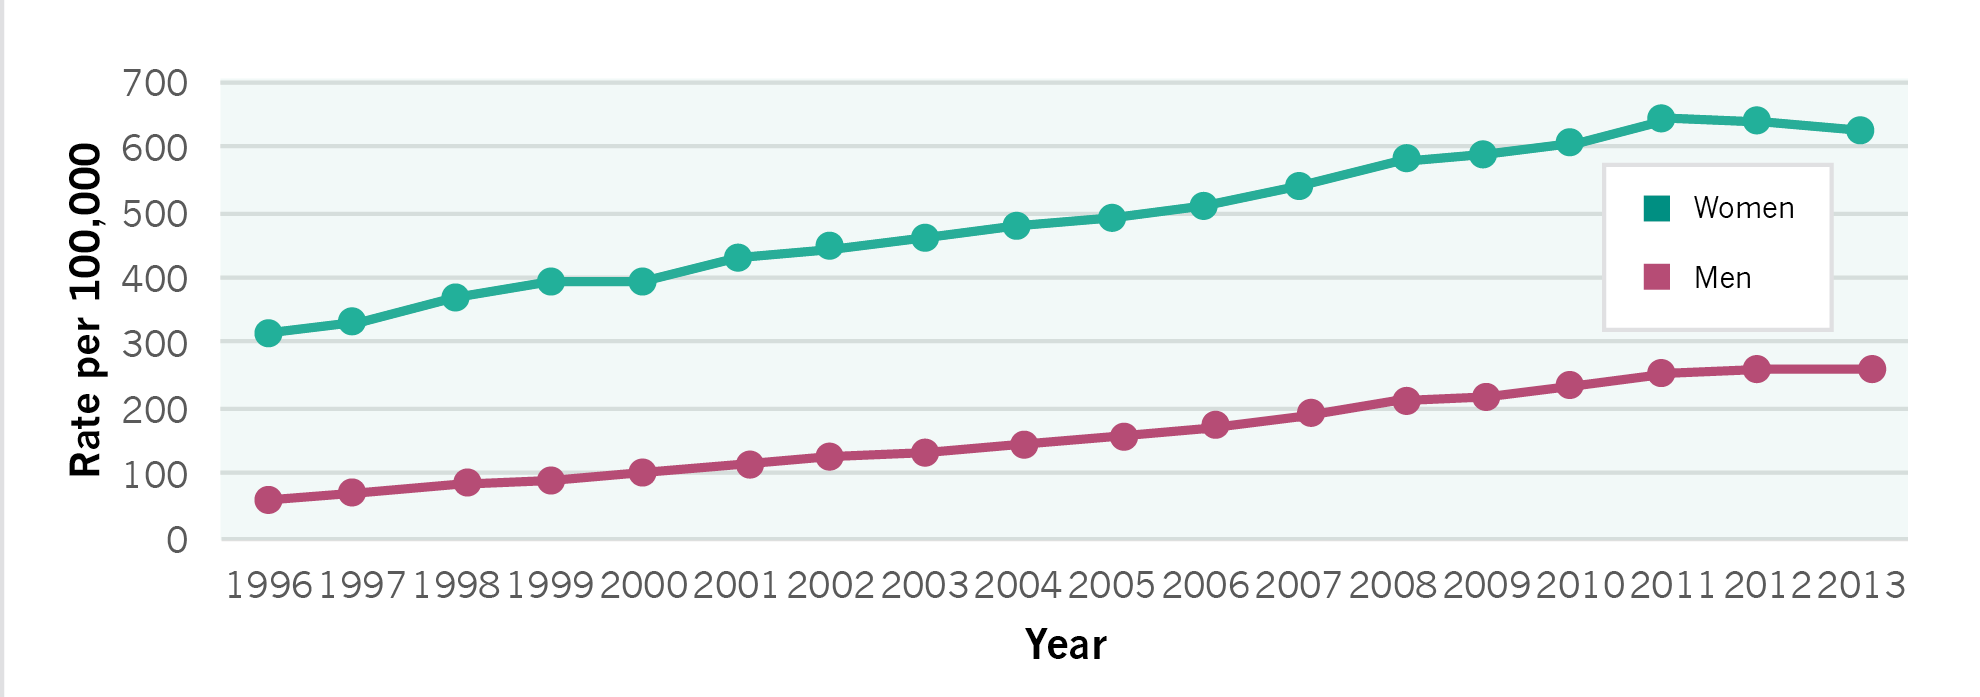
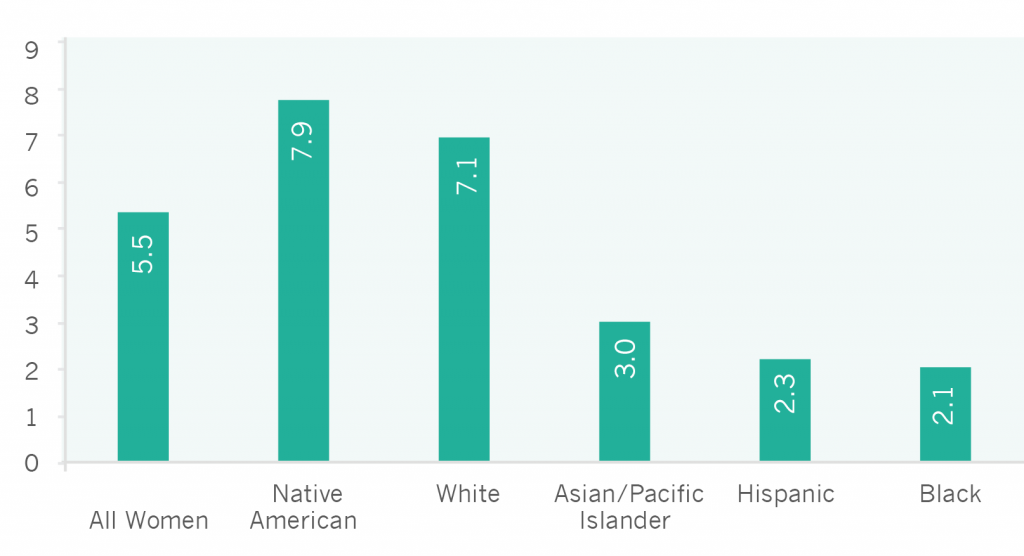
In the United States overall, women’s health status has improved in some areas and declined in others. Women’s mortality rates from heart disease, lung cancer, and breast cancer have decreased since the publication of IWPR’s 2004 Status of Women in the States report, as has the incidence of AIDS among female adolescents and adults. Women’s incidence of chlamydia and diabetes, however, have increased (IWPR 2004; Table 6.1). In addition, the average number of poor mental health days per month, suicide mortality rate, and average number of days per month of limited activities have also gone up for women.

View All State Rankings See Key Indicators
Best Worst
1. Minnesota 51. Mississippi
2. Hawaii 50. Alabama
3. North Dakota 49. Louisiana
4. Utah 48. District of Columbia
5. Nebraska 47. Arkansas
National Overview

Women

Men

Heart Disease Mortality (per 100,000 people)

136.1

215.8

Lung Cancer Mortality (per 100,000 people)

36.3

55.8

Breast Cancer Mortality (per 100,000 people)

21.3

0.3

Incidence of Diabetes

10.0%

10.4%

Incidence of Chlamydia (per 100,000 people)

623.1

262.6

Incidence of AIDS (per 100,000 people)

4.8

15.3

Poor Mental Health (mean # of days in past 30 days)

4.3

3.3

Suicide Mortality (per 100,000 people)

5.4

20.2

Limited Activities (mean # of days in past 30 days)

4.8

4.9

Notes: For purposes of comparing with earlier IWPR Status of Women in the States reports, the median has been calculated for all 50 states and the District of Columbia for incidence of diabetes (9.7%), poor mental health (4.2 days), and limited activities (4.6 days). See Methodological Appendix.       
Calculated by the Institute for Women’s Policy Research.


Chronic Disease

One in four women in the United States dies from heart disease (U.S. Department of Health and Human Services 2014). Coronary heart disease—which is the most common form—is the leading cause of death among both women and men. In addition, women are at higher risk than men for other forms of heart disease, such as coronary microvascular disease (in which the walls of the heart’s tiny arteries are damaged or diseased) and stress-induced cardiomyopathy (in which emotional stress leads to severe—but often temporary—heart muscle failure; U.S. Department of Health and Human Services 2014).

Read More See the Data

Heart Disease Mortality Rates (per 100,000) Among Women by Race/Ethnicity, United States, 2013
fig 6.1

Mortality and Incidence of Disease Among Women by Race and Ethnicity, United States

All Women

White

Hispanic

Black

Asian/Pacific Islander

Native American

Average Annual Mortality Rate from Heart Disease (per 100,000), 2013

136.1

136.4

98.8

177.7

74.9

121.1

Average Annual Mortality Rate from Lung Cancer (per 100,000), 2013

36.3

39.9

13.3

35.7

18.3

31.1

Average Annual Mortality Rate from Breast Cancer (per 100,000), 2013

21.3

21.2

14.4

30.2

11.3

13.8

Average Annual Incidence Rate of AIDS (per 100,000 adolescents and adults), 2012

4.8

1.2

4.7

27.5

0.9

3.1

Average Annual Incidence Rate of Chlamydia (per 100,000), 2013

623.1

258.5

564.2

1,491.70

154.6

1,079.20

Notes: Mortality rates include women of all ages and are age-adjusted to the 2000 U.S. standard population. For heart disease, AIDS, lung cancer, and breast cancer, all racial groups are non-Hispanic. For chlamydia, only whites and blacks are non-Hispanic and Pacific Islanders are not included with Asians. Hispanics may be of any race or two or more races. Data are not available for those who identify with another race or with two or more races.
Source: IWPR compilation of data from the Centers for Disease Control and Prevention.


Sexual Health

National data show that women are more likely than men to be diagnosed with a sexually transmitted infection, or STI (U.S. Department of Health and Human Services 2012a). Women are biologically more susceptible to certain STIs than men (Centers for Disease Control and Prevention 2011b). In addition, women visit the doctor more often—and, therefore, may be more likely to be screened for STIs (Centers for Disease Control and Prevention 2011b). As with many other health problems, education, awareness, and proper screening can limit the spread of STIs and diminish their health impact.

Read More

Rate of Chlamydia by Gender (per 100,000), United States, 1996–2013
fig 6.3

Mental Health

Women have higher incidences than men of certain mental health conditions, including anxiety, depression, and eating disorders (Eaton et al. 2012). Multiple factors may contribute to women’s greater likelihood of experiencing such conditions, including higher rates of poverty (Heflin and Iceland 2009), greater responsibility in caring for disabled or ill family members (Cannuscio et al. 2002), and trauma from gender-based violence (Rees et al. 2011).

Read More See the Data

Suicide Mortality Rates Among Women (per 100,000) by Race and Ethnicity, United States, 2013
fig 6.4

Suicide Mortality Rates Among Women (per 100,000) by Race and Ethnicity, United States, 2013

All Women

5.5

Native American

7.9

White

7.1

Asian/Pacific Islander

3.0

Hispanic

2.3

Black

2.1

Notes: Data include women of all ages and are age-adjusted to the 2000 U.S. standard population. Racial categories are non-Hispanic. Hispanics may be of any race.
Source: IWPR compilation of data from the Center for Disease Control and Prevention’s Web-based Injury Statistics Query and Reporting (WISQARS).


Limitations on Women’s Activities

Illness, disability, and overall poor health make it difficult for women to thrive at home and in the workplace. IWPR analysis indicates that women aged 18 and older who participated in the Centers for Disease Control and Prevention’s 2013 Behavioral Risk Factor Surveillance System survey reported that their activities were limited by their health status for an average of 4.8 days in the month preceding the survey (Table 6.1).

Read More See the Data
face old woman staring out
Average Number of Days per Month of Limited Activities Among Women, by Race/Ethnicity and State, 2013

All Women

4.8

White

4.7

Hispanic

4.7

Black

5.5

Asian/ Pacific Islander

3.2

Native American

7.0

Other Race or Two or More Races

5.9

Notes: Data are for women aged 18 and older. Data for all women are for 2013; all other data are three-year (2011–2013) averages. Racial groups are non-Hispanic. Hispanics may be of any race or two or more races.
Source: IWPR analysis of Behavioral Risk Factor Surveillance System microdata.


Obesity and Healthy Weight

Being overweight or obese is a growing health concern for women in the United States. Nationally, nearly six in ten women (57.6 percent) aged 18 and older are overweight or obese (classified as having a body mass index of 25 or greater; Appendix Tables B6.10 and B6.11). Overweight and obesity rates vary across the states.

Read More See the Data
Percent of Women Who Are Overweight or Obese by Race/Ethnicity and State, 2013

All Women

57.6%

White

54.3%

Hispanic

63.7%

Black

73.3%

Asian/ Pacific Islander

30.5%

Native American

64.1%

Other Race or Two or More Races

57.8%

Notes: Percent of women with a BMI of 25 or greater. Data for all women include those aged 18 and older and are for 2013; all other data are three-year (2011–2013) averages. Racial groups are non-Hispanic. Hispanics may be of any race or two or more races.
Source: IWPR analysis of Behavioral Risk Factor Surveillance System microdata.


Preventive Care and Health Behaviors

Practicing preventive health care and maintaining good health behaviors are important components of women’s health and overall well-being.

Read More See the Data
HWB Cover Photo FINAL
Health Behaviors and Preventive Care Among Women by Race and Ethnicity, United States

All Women

White

Hispanic

Black

Asian/Pacific Islander

Native American Other Race or Two or More Races

Percent Who Exercise 150 Minutes per Week or More, 2013

48.2%

51.0%

42.5%

39.6%

45.4%

48.9% 50.8%

Percent Who Eat Five or More Servings of Fruits and Vegetables per Day, 2013

20.6%

20.0%

23.7%

19.0%

23.5%

20.4% 24.3%

Percent Who Smoke (Some Days or Every Day and Have Smoked at Least 100 Cigarettes in Lifetime), 2013

15.8%

17.5%

9.2%

16.3%

4.8%

30.5% 21.9%

Percent Who Report Binge Drinking (Four or More Drinks on One Occasion at Least Once in the Past Month), 2013

11.2%

12.1%

10.1%

8.4%

8.3%

11.3% 14.4%

Percent Aged 50 and Older Who Have Had a Mammogram in Past Two Years, 2012

80.9%

80.3%

80.0%

85.6%

85.7%

75.4% 75.4%

Percent Who Have Had a Pap Test in the Past Three Years, 2012

79.5%

76.3%

86.9%

87.0%

87.1%

76.8% 80.1%

Percent Who Have Been Screened for Cholesterol in the Past Five Years, 2013

61.6%

63.6%

51.4%

65.8%

57.4%

57.4% 56.3%

Percent Who Have Ever Been Tested for HIV, 2013

39.0%

32.5%

50.8%

60.7%

33.3%

45.0% 51.3%
Notes: Data are for women aged 18 and older, except for the percent of women who have had a mammogram in the past two years. Racial groups are non-Hispanic. Hispanics may be of any race or two or more races.
Source: IWPR analysis of Behavioral Risk Factor Surveillance System microdata.


View Additional State Data

View additional tables with state-level data on the indicators discussed in this section. Much of the data is also disaggregated by race and ethnicity.

View the Additional Data by State
Back to Top

Download the Data

State-level data are available for women’s and men’s health and well-being composite indicators, women’s health behaviors and preventive health,  age breakdowns on women’s mental health, incidence of diabetes, limitations on activities and obesity rates, and breakdowns on race and ethnicity for women’s rates of heart disease mortality, lung cancer mortality, breast cancer mortality, diabetes, mental health, activity limitations, obesity and HIV screenings.