Political Participation

A
B
C
D to F

In this Section

Political Participation

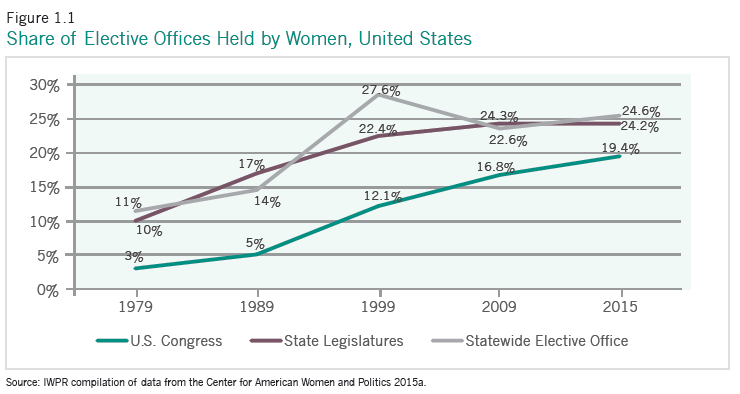
Between 2004 and 2015, the number and share of women in state legislatures and in the U.S. Senate and House of Representatives increased, while the number and share of women in statewide elective executive office declined (CAWP 2015a; IWPR 2004). Women’s voter registration and turnout also showed signs of both progress and lack of progress: the percentage of women who registered to vote was lower in the 2010/2012 elections than in the 1998/2000 elections, but the percentage of women who went to the polls increased during this period (Table 1.1; IWPR 2004).

View All State Rankings See Key Indicators
Best Worst
0. District of Columbia 50. Utah
1. New Hampshire 49. Texas
2. Minnesota 48. West Virginia
3. Maine 47. Arkansas
4. Washington 46. Louisiana
National Overview
Women Men
Women in Elected Office Index 2.04 n/a
Percent Registered to Vote, 2010/2012 Average 64.3% 60.5%
Percent Who Voted, 2010/ 2012 Average 50.6% 47.7%
Women’s Institutional Resources Index 1.0 n/a
Note: Data on voter registration and turnout include all women aged 18 and older who reported registering to vote and voting, based on the 2010 and 2012 November Voting and Registration Supplements of the Current Population Survey.
See Appendix A1 for methodology and sources.


Voter Registration and Turnout

In the United States, women are considerably more likely to be registered to vote and to go to the polls than men. Nationally, 61.5 percent of women were registered to vote in the 2010 midterm election and 42.7 percent voted, compared with 57.9 percent of men who registered to vote and 40.9 percent who cast a ballot (U.S. Department of Commerce 2011). In the 2012 general election, 67.0 percent of women were registered to vote and 58.5 percent voted, compared with 63.1 percent and 54.4 percent of men (U.S. Department of Commerce 2013). Registration and turnout are higher for both women and men in presidential election years than in midterm election years, when, in terms of national office, only members of Congress are elected.

Read More See the Data
woman voting (needs citation on website)
Women’s and Men’s Voter Registration and Turnout, 2010 and 2012
Women Men
Percent Registered to Vote, 2010 61.5% 57.9%
Percent Voted, 2010 42.7% 40.9%
Percent Registered to Vote, 2012 67.0% 63.1%
Percent Voted, 2012 58.5% 54.4%
Note: Data on voter registration and turnout include all women aged 18 and older who reported registering to vote and voting, based on the 2010 and 2012 November Voting and Registration Supplements of the Current Population Survey.
Source: U.S. Department of Commerce, Bureau of the
Census 2010 and 2012, based on the Current Population
Survey


Women in Elected Office

Although women have become increasingly active in U.S. politics, the majority of political office holders at the state and federal levels are still male. As of March 2015, women held just 104 of 535 (19.4 percent) seats in the U.S. Congress, 1,786 of 7,383 (24.2 percent) seats in the nation’s state legislatures, and 78 of 317 (24.6 percent) statewide elective executive offices (Table 1.2). Among women of color, the level of representation is especially low: women of color—who constitute approximately 18 percent of the population aged 18 and older (IWPR 2015b)—hold about 6.2 percent of seats in the U.S. Congress, 5.3 percent of seats in state legislatures, and 2.8 percent of statewide elective executive positions (Table 1.2).

Read More See the Data
Figure 1.1
Women of Color in Elected Office in the United States, 2015
Number and Percent of Women in the U.S. Congress 104 of 535 19.4%
U.S. Senate 20 of 100 20.0%
Women of Color 1 1.0%
U.S. House 84 of 435 19.3%
Women of Color 32 7.4%
Number and Percent of State Senate and House Seats Held by Women 1,786 of 7,383 24.2%
State Senate 436 of 1,972 22.1%
Women of Color 102 5.2%
State House 1,350 of 5,411 24.9%
Women of Color 288 5.3%
Number and Percent of Women in Statewide Executive Elected Office 78 of 317 24.6%
Women of Color 9 2.8%
Share of Elective Offices Held By Women, United States U.S. Congress State Legislatures Statewide Elective Office
1979 3.0% 10.0% 11.0%
1989 5.0% 17.0% 14.0%
1999 12.1% 22.4% 27.6%
2009 16.8% 24.3% 22.6%
2015 19.4% 24.2% 24.6%
Source: Center for American Women and Politics (CAWP) 2015a, 2015b, 2015d and 2015e.
Compiled by the Institute for Women’s Policy Research.


Women's Institutional Resources

In addition to women’s voting and election to local, state, and federal offices, institutional resources dedicated to helping women succeed in the political arena and to promoting and prioritizing women’s policy issues play a key role in connecting women constituents to policymakers. Such resources include campaign trainings for women, women’s Political Action Committees (PACs), women’s commissions, and state chapters of the National Women’s Political Caucus (NWPC). These institutional resources serve to amplify the voices of women in government and increase the access of women, their families, and their communities to decision makers on the policy issues that matter most to them. Institutional resources and statewide associations also provide peer support systems for female elected officials and establish informal networks that can help them navigate a political system that remains predominantly male (Strimling 1986).

Read More
Women at polling place _LG

View Additional Data by State

See additional state-level data on women in congress and state legislatures; women of color in congress, state legislatures and statewide elected offices; and institutional resources.

View the Additional Data by State
Back to Top

Download the Data

See additional state-level data on women in congress and state legislatures; women of color in congress, state legislatures and statewide elected offices; and institutional resources.